 Home
Home Products
 Resources
 Solutions
 Pricing
 Company
 Find Us
AI Agent Observability in Practice
When your AI Agents grow from 1 to 50, can you still tell how many tokens each Agent consumes and which model's concurrency is about to max out?

Summary
After deploying AI Agents, the most overlooked aspect isn't the build—it's runtime observability. When an enterprise runs dozens of AI Agents simultaneously, model token consumption, concurrency bottlenecks, knowledge base capacity, and plugin call volumes can spiral out of control in any dimension, leading to service degradation or runaway costs.
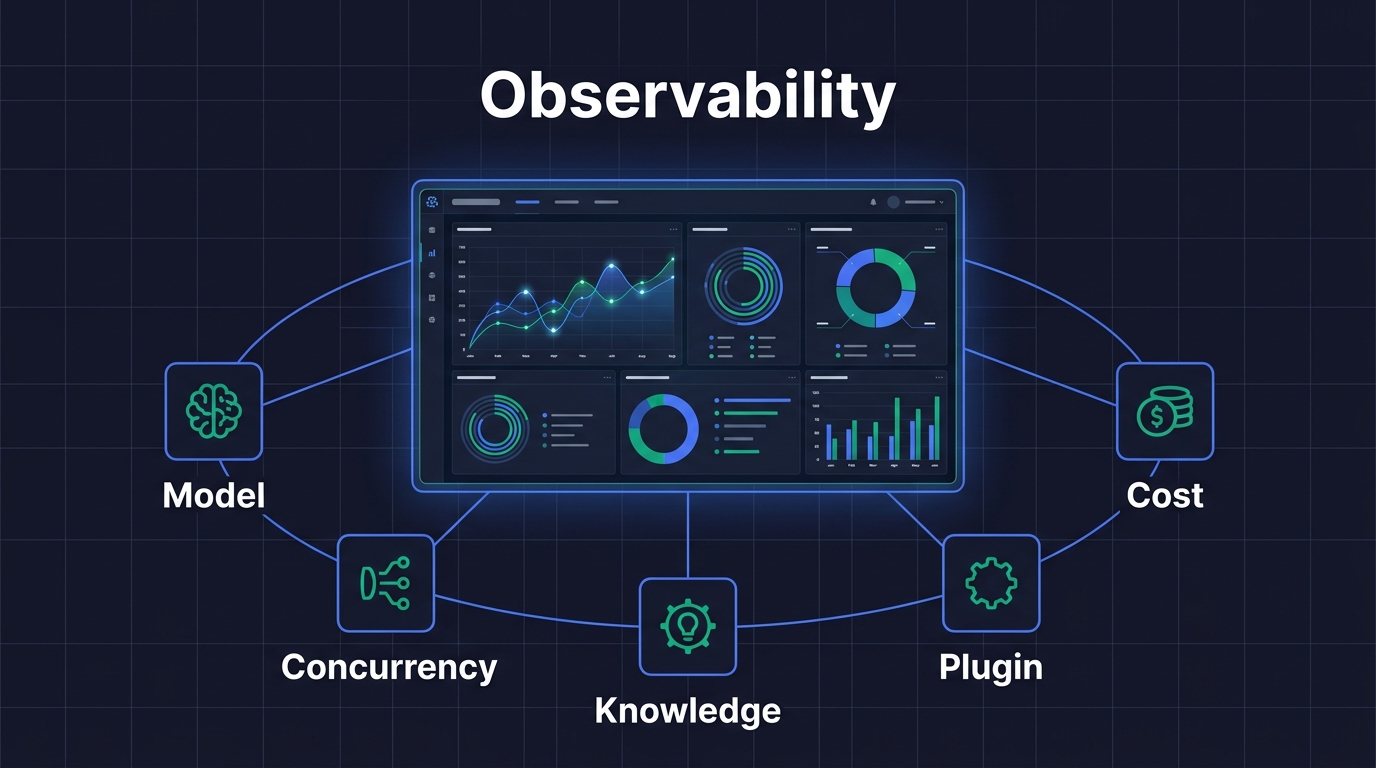
AI Agent Observability is a systematic monitoring and analysis capability for tracking AI Agent runtime status, resource consumption, and performance bottlenecks in real time. Tencent Cloud ADP provides a Resource Dashboard with a two-tier monitoring architecture—Enterprise View and Space View—covering 7 key dimensions: model usage, model concurrency, knowledge base capacity, plugin usage, platform usage, usage summary, and resource consumption details.
Key Takeaways:
- Enterprise View + Space View two-tier resource dashboard architecture meets both executive-level global oversight and team-level operational needs
- 7 monitoring dimensions cover the full AI Agent resource consumption chain, from token usage to concurrency bottlenecks at a glance
- Per-application cost attribution makes every AI Agent's ROI quantifiable and traceable
- Resource consumption details support PU (Platform Unit) deduction tracking for evidence-based enterprise cost management
1. Why Do AI Agents Need Observability?
AI Agent Observability refers to the systematic collection, analysis, and visualization of resource consumption, performance metrics, and anomalous states during AI Agent runtime. It consolidates scattered operational data into actionable insights through a Resource Dashboard.
An AI Agent that runs smoothly in a demo doesn't guarantee stability in production. When enterprises run dozens of Agents simultaneously, the following issues surface quickly:
| Problem Type | Typical Scenario | Business Impact |
|---|---|---|
| Token consumption out of control | An Agent's prompt design is inefficient, consuming 5x the expected tokens per conversation | Monthly bill exceeds budget by 200% |
| Concurrency bottleneck | QPM maxed out during peak hours, user requests queuing | Response latency spikes from 2s to 30s |
| Knowledge base capacity overflow | Documents exceed capacity, new docs can't be indexed, Agent answers based on outdated information | Answer accuracy drops, user complaints increase |
| Unclear cost attribution | Unable to identify which Agent consumes the most resources | No ROI analysis possible, can't optimize resource allocation |
Without observability, enterprise AI Agent management is flying blind—problems are discovered only after they occur, and root causes remain unknown.
2. Enterprise View and Space View: Two-Tier Resource Dashboard Architecture
The Resource Dashboard in Tencent Cloud ADP adopts a two-tier architecture with Enterprise View and Space View, which is the key design for achieving AI Agent Monitoring from global overview to granular detail.
Enterprise View: The Executive Command Center
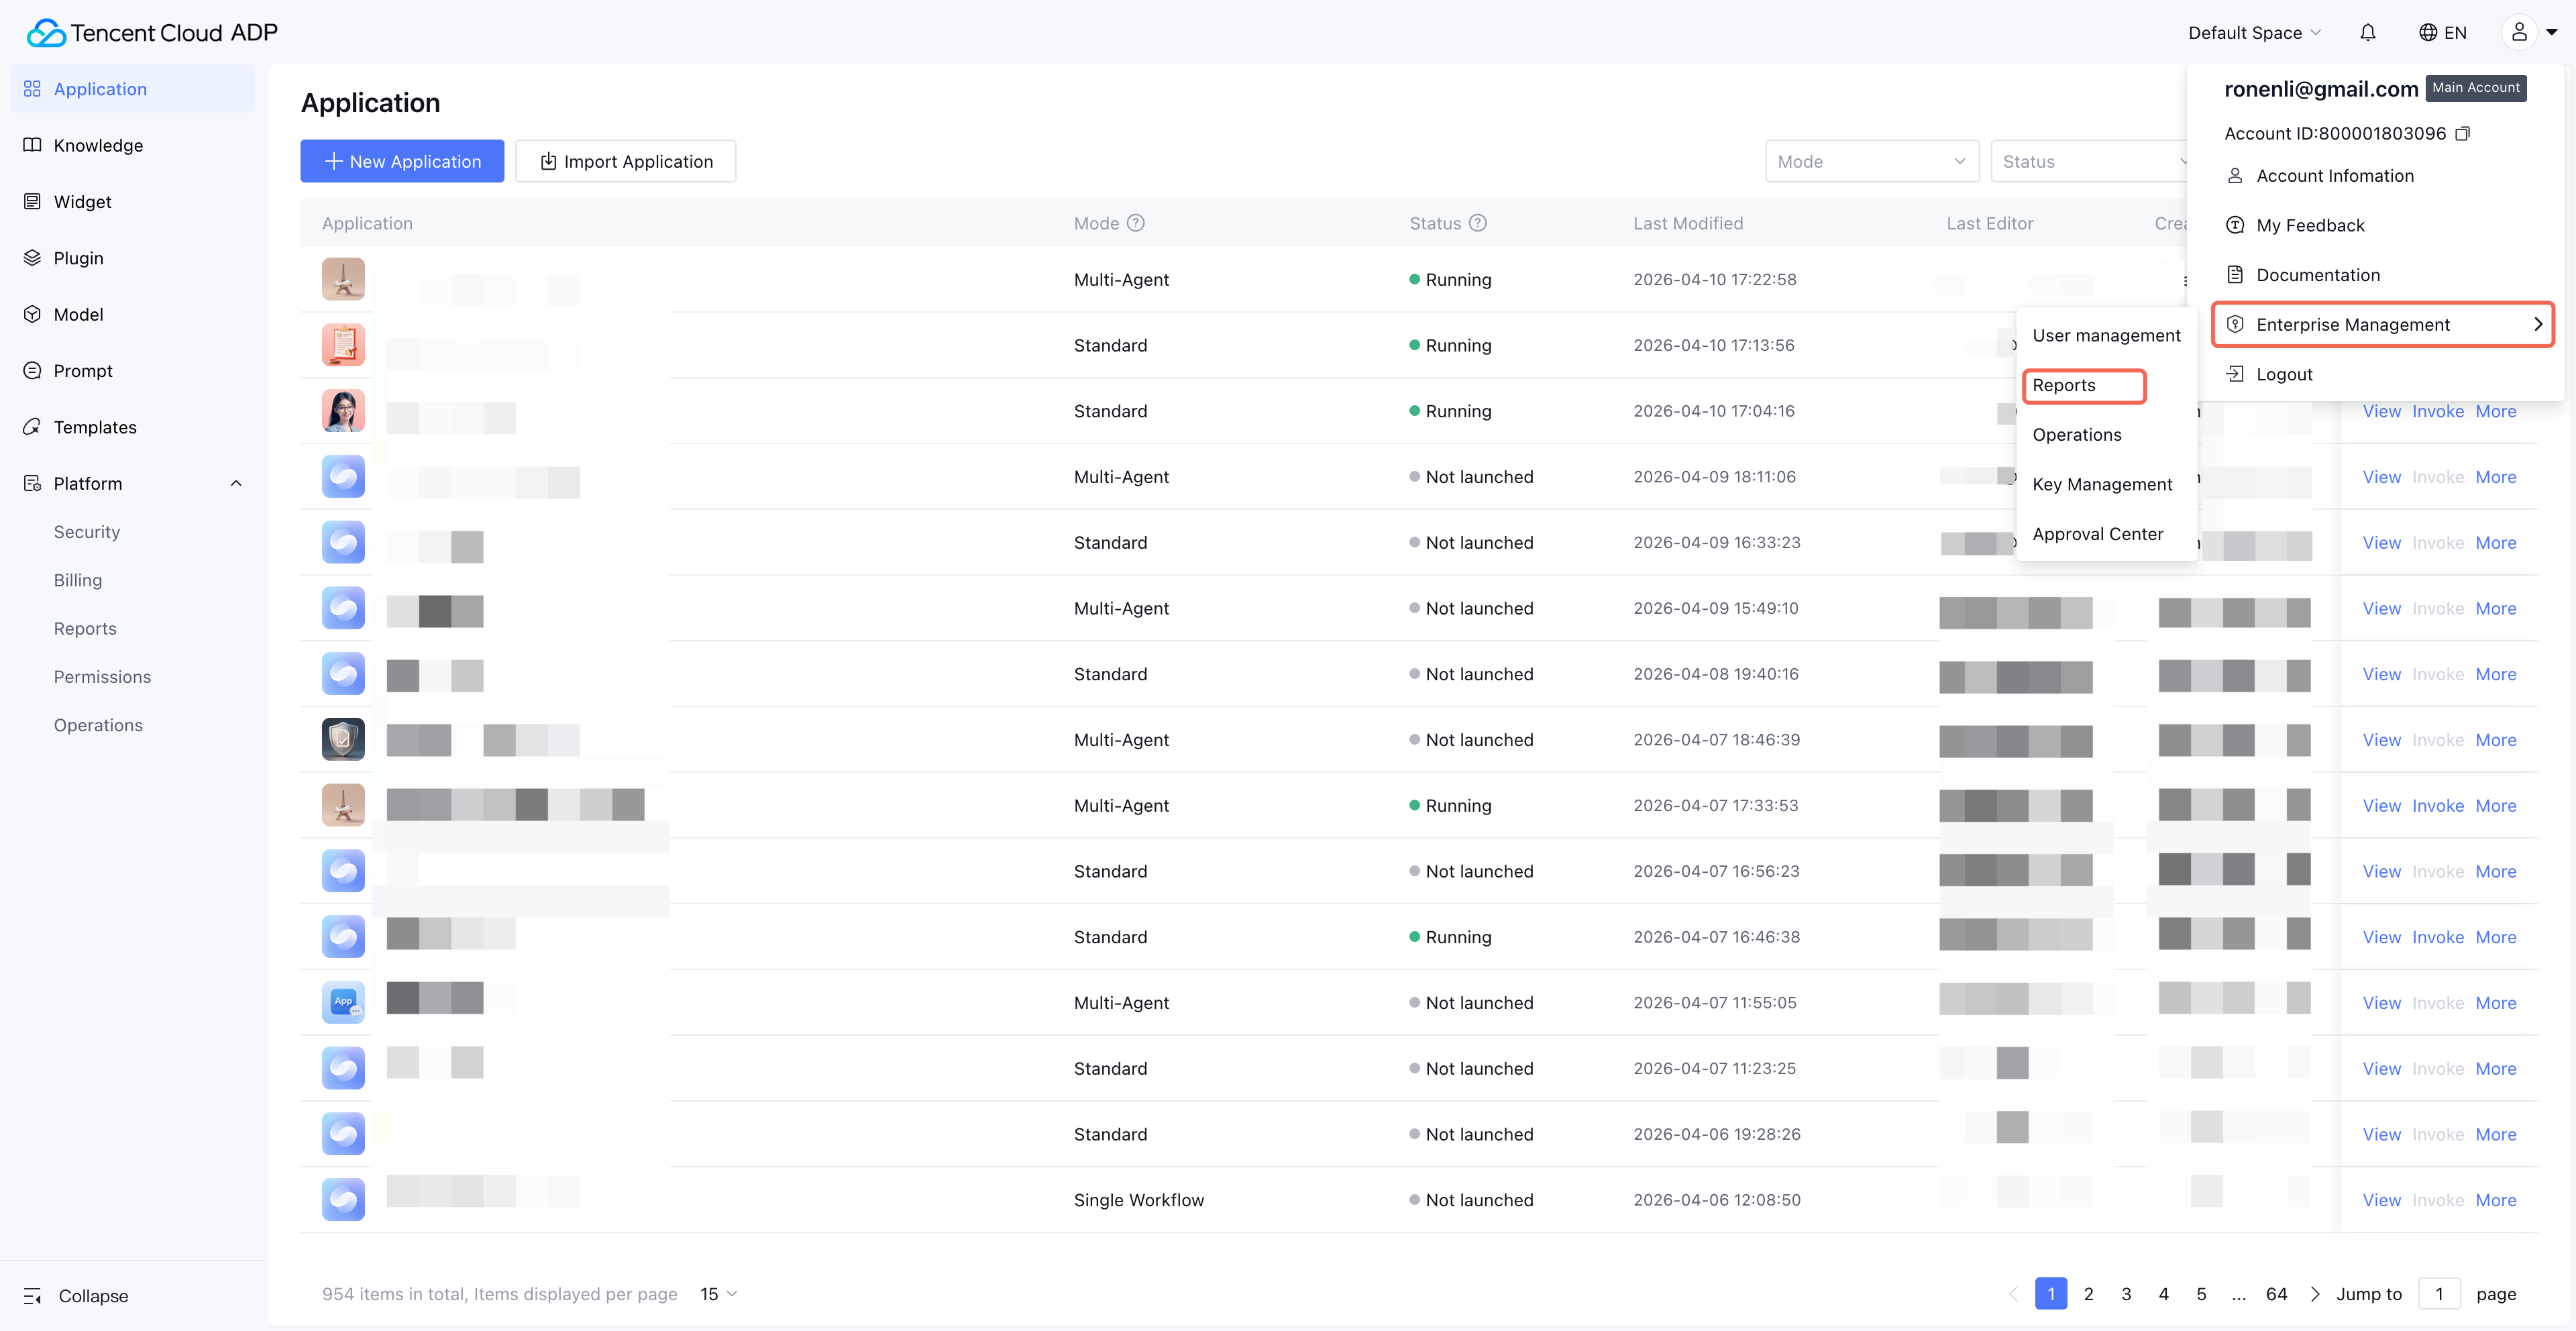
Entry Point: Avatar (top-right) > Enterprise Management > Reports. Visible only to super administrators.
The Enterprise View provides cross-space resource consumption summaries, ideal for CTOs and technical directors. In this view, you can see the entire enterprise's model token consumption trends, resource distribution across spaces, and whether any space is approaching resource limits.
Space View: The Team Operations Console
Entry Point: Each space's Platform > Reports > Resource Dashboard. Visible to space administrators by default; other users require authorization.
The Space View focuses on a single business space, displaying resource usage details for each application and knowledge base within that space. Product managers and development leads can track the resource consumption of the Agents they're responsible for.
The Synergy of Two-Tier Architecture
| Dimension | Enterprise View | Space View |
|---|---|---|
| Target Users | Super administrators, CTO | Space administrators, development leads |
| Data Scope | All spaces under the enterprise | All applications within a single space |
| Core Scenarios | Budget control, resource allocation decisions | Application optimization, issue diagnosis |
| Typical Action | Discover "Space A accounts for 60% of consumption" → drill down to Space A | Discover "Agent X has abnormal token consumption" → view call details |
This two-tier architecture gives AI Agent resource monitoring both a global perspective and the ability to drill down to specific applications—a core capability of an enterprise-grade Agent Management Platform.
3. Model Usage Monitoring: Full-Chain Token Consumption Tracking
Model usage is the most critical monitoring dimension in AI Agent Observability. The Resource Dashboard in Tencent Cloud ADP supports unified usage monitoring for both built-in platform models and integrated third-party models.
Model Types Covered
| Model Type | Unit | Typical Scenario |
|---|---|---|
| Generation Model | Token | Agent conversation replies |
| Reasoning Model | Token | Complex reasoning tasks |
| Multimodal Model | Token | Image understanding, voice processing |
| Rewriting Model | Token | Content polishing, format adjustment |
| Embedding Model | Token | Knowledge base document vectorization |
| Reranking Model | Token | Search result ranking optimization |
| Document Parsing Model | Pages | Document ingestion and parsing |
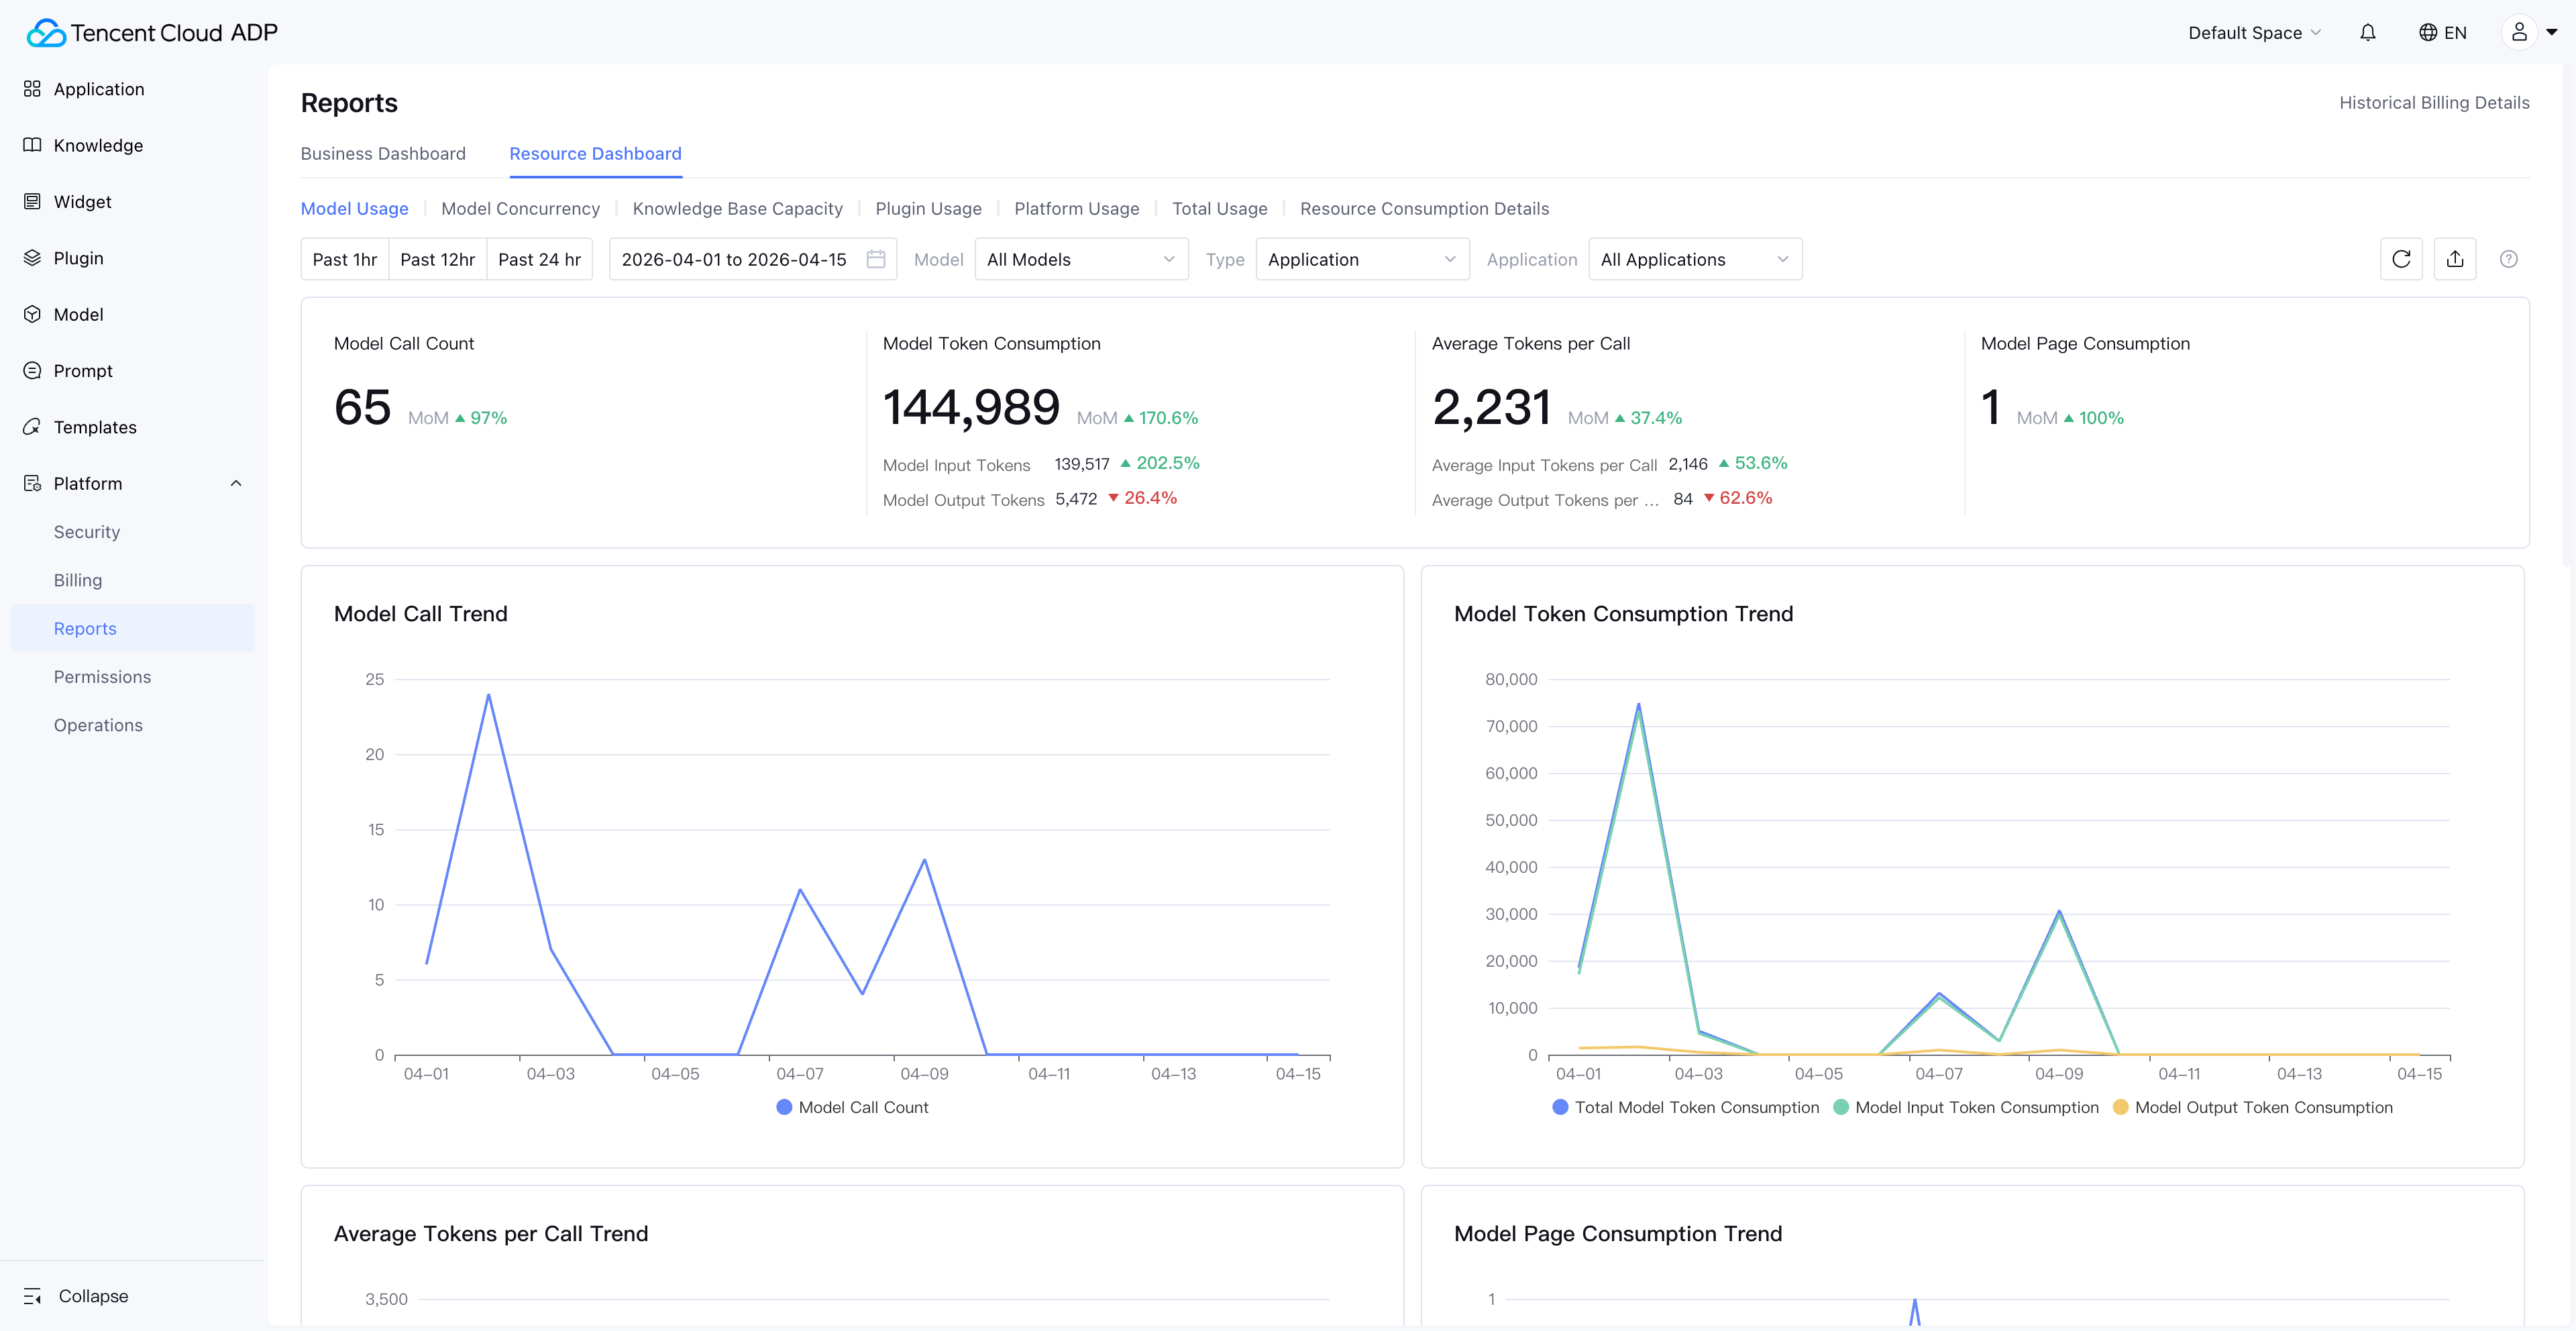
Drill-Down Path from Overview to Details
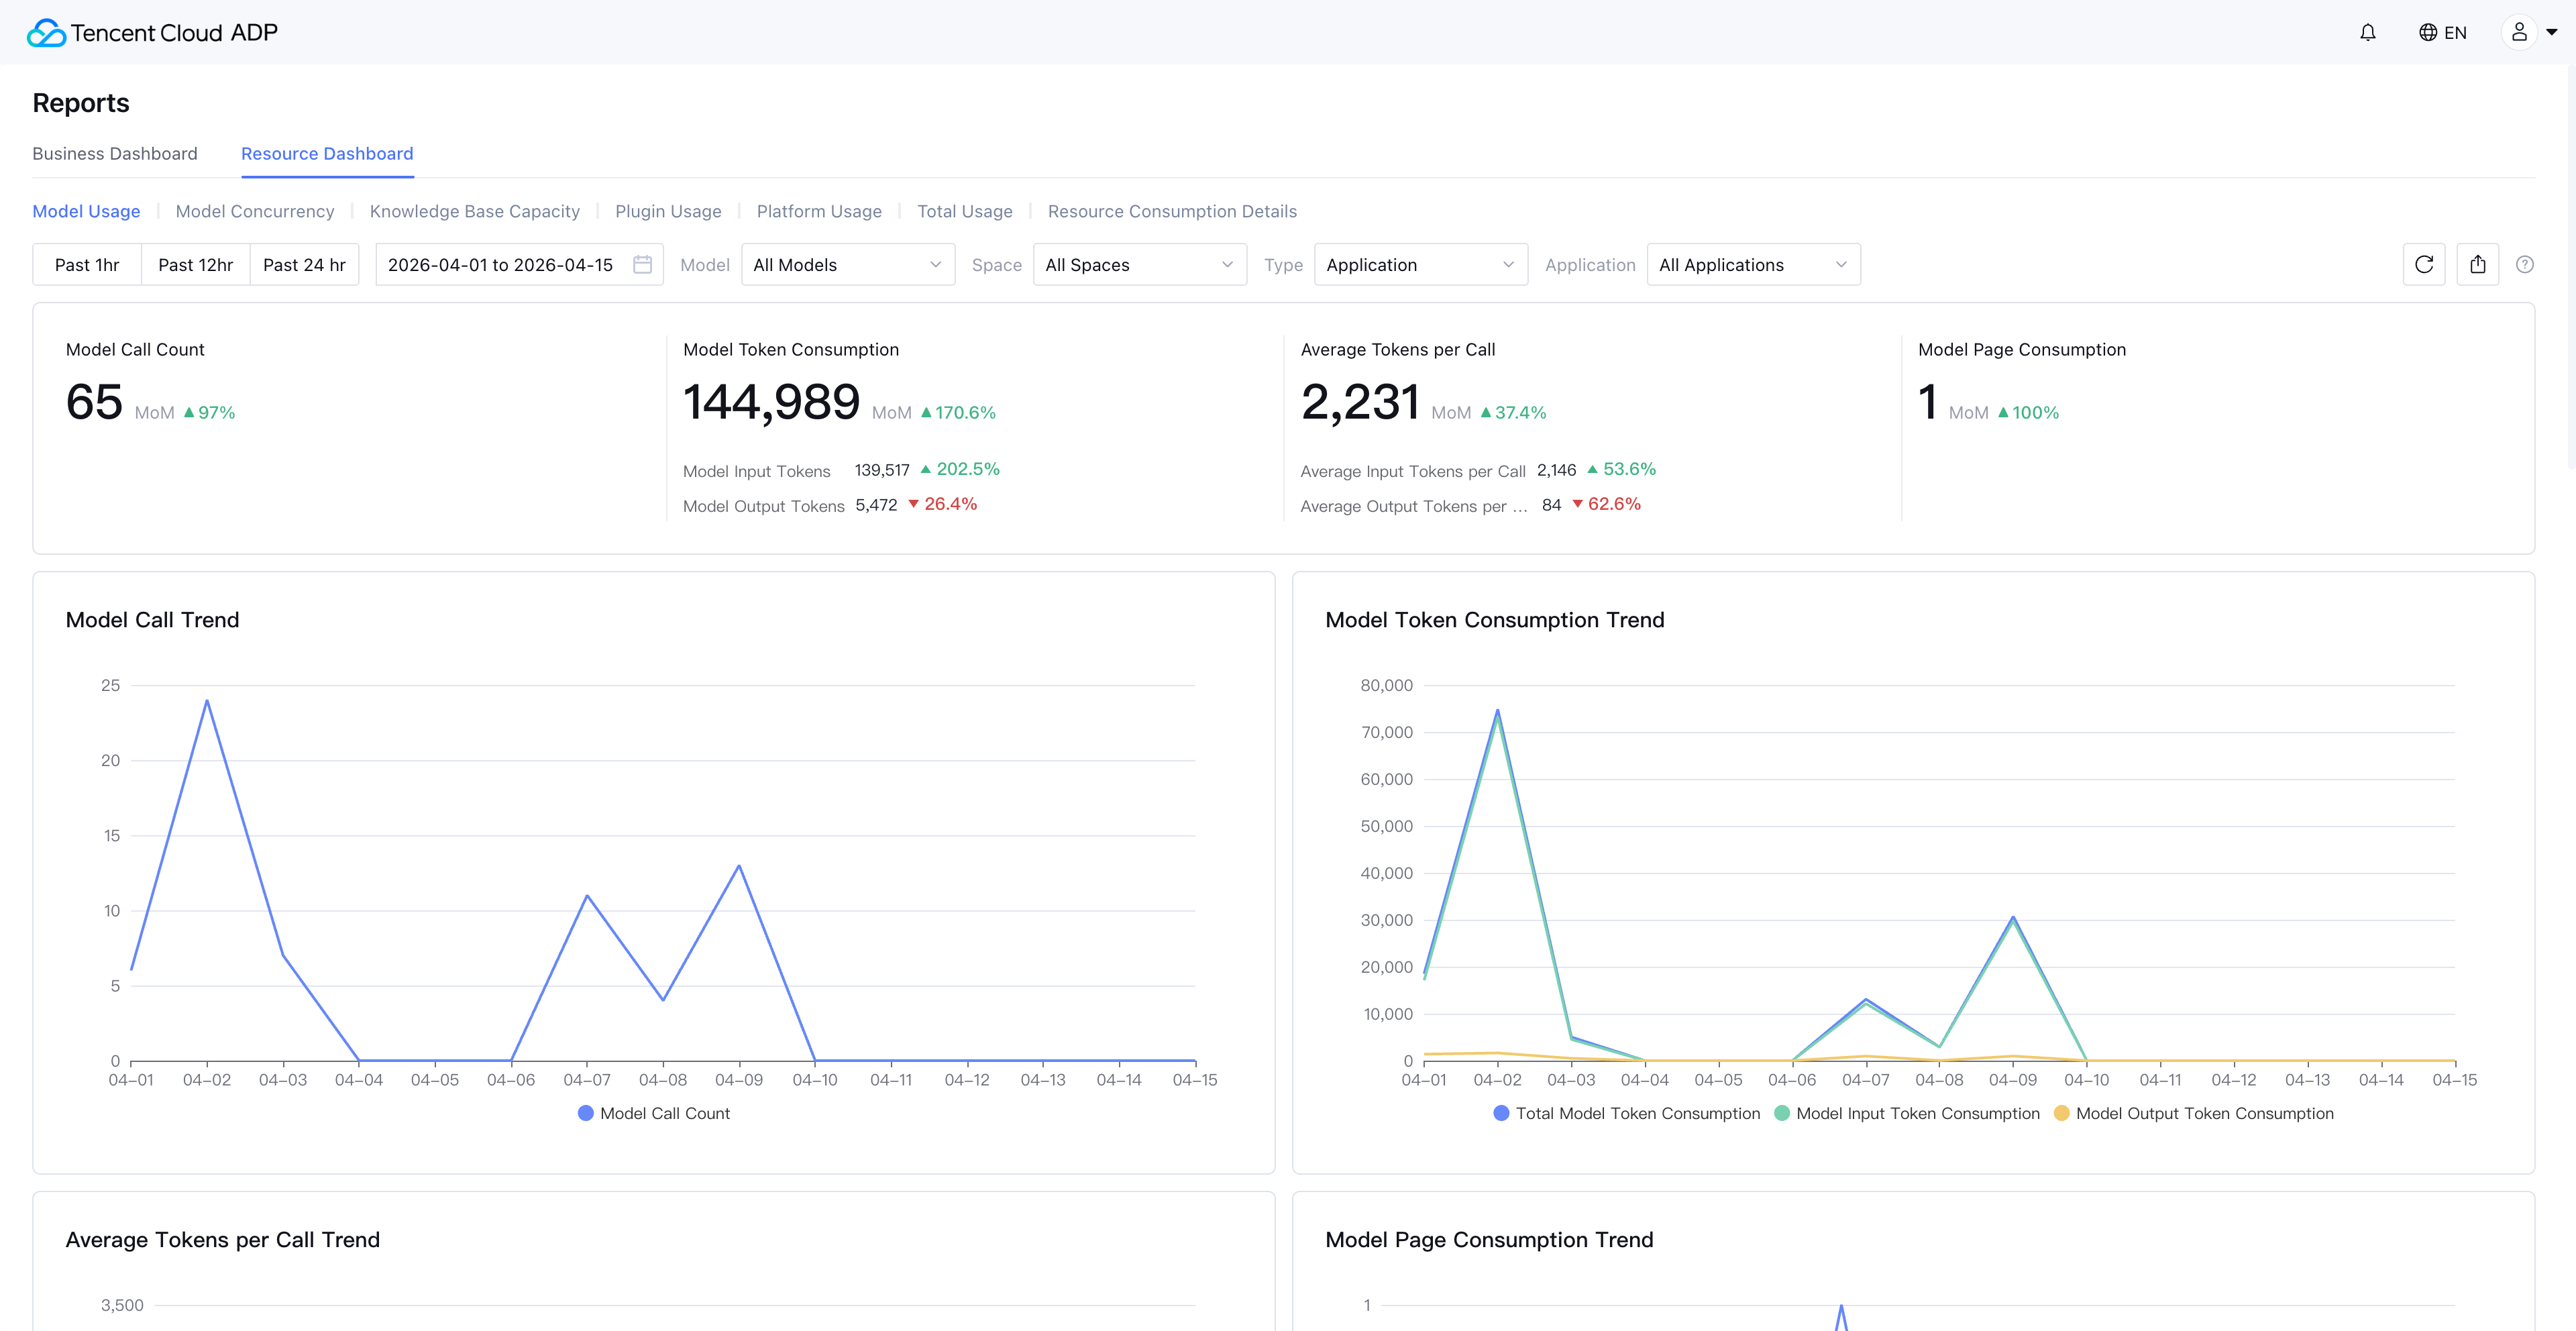
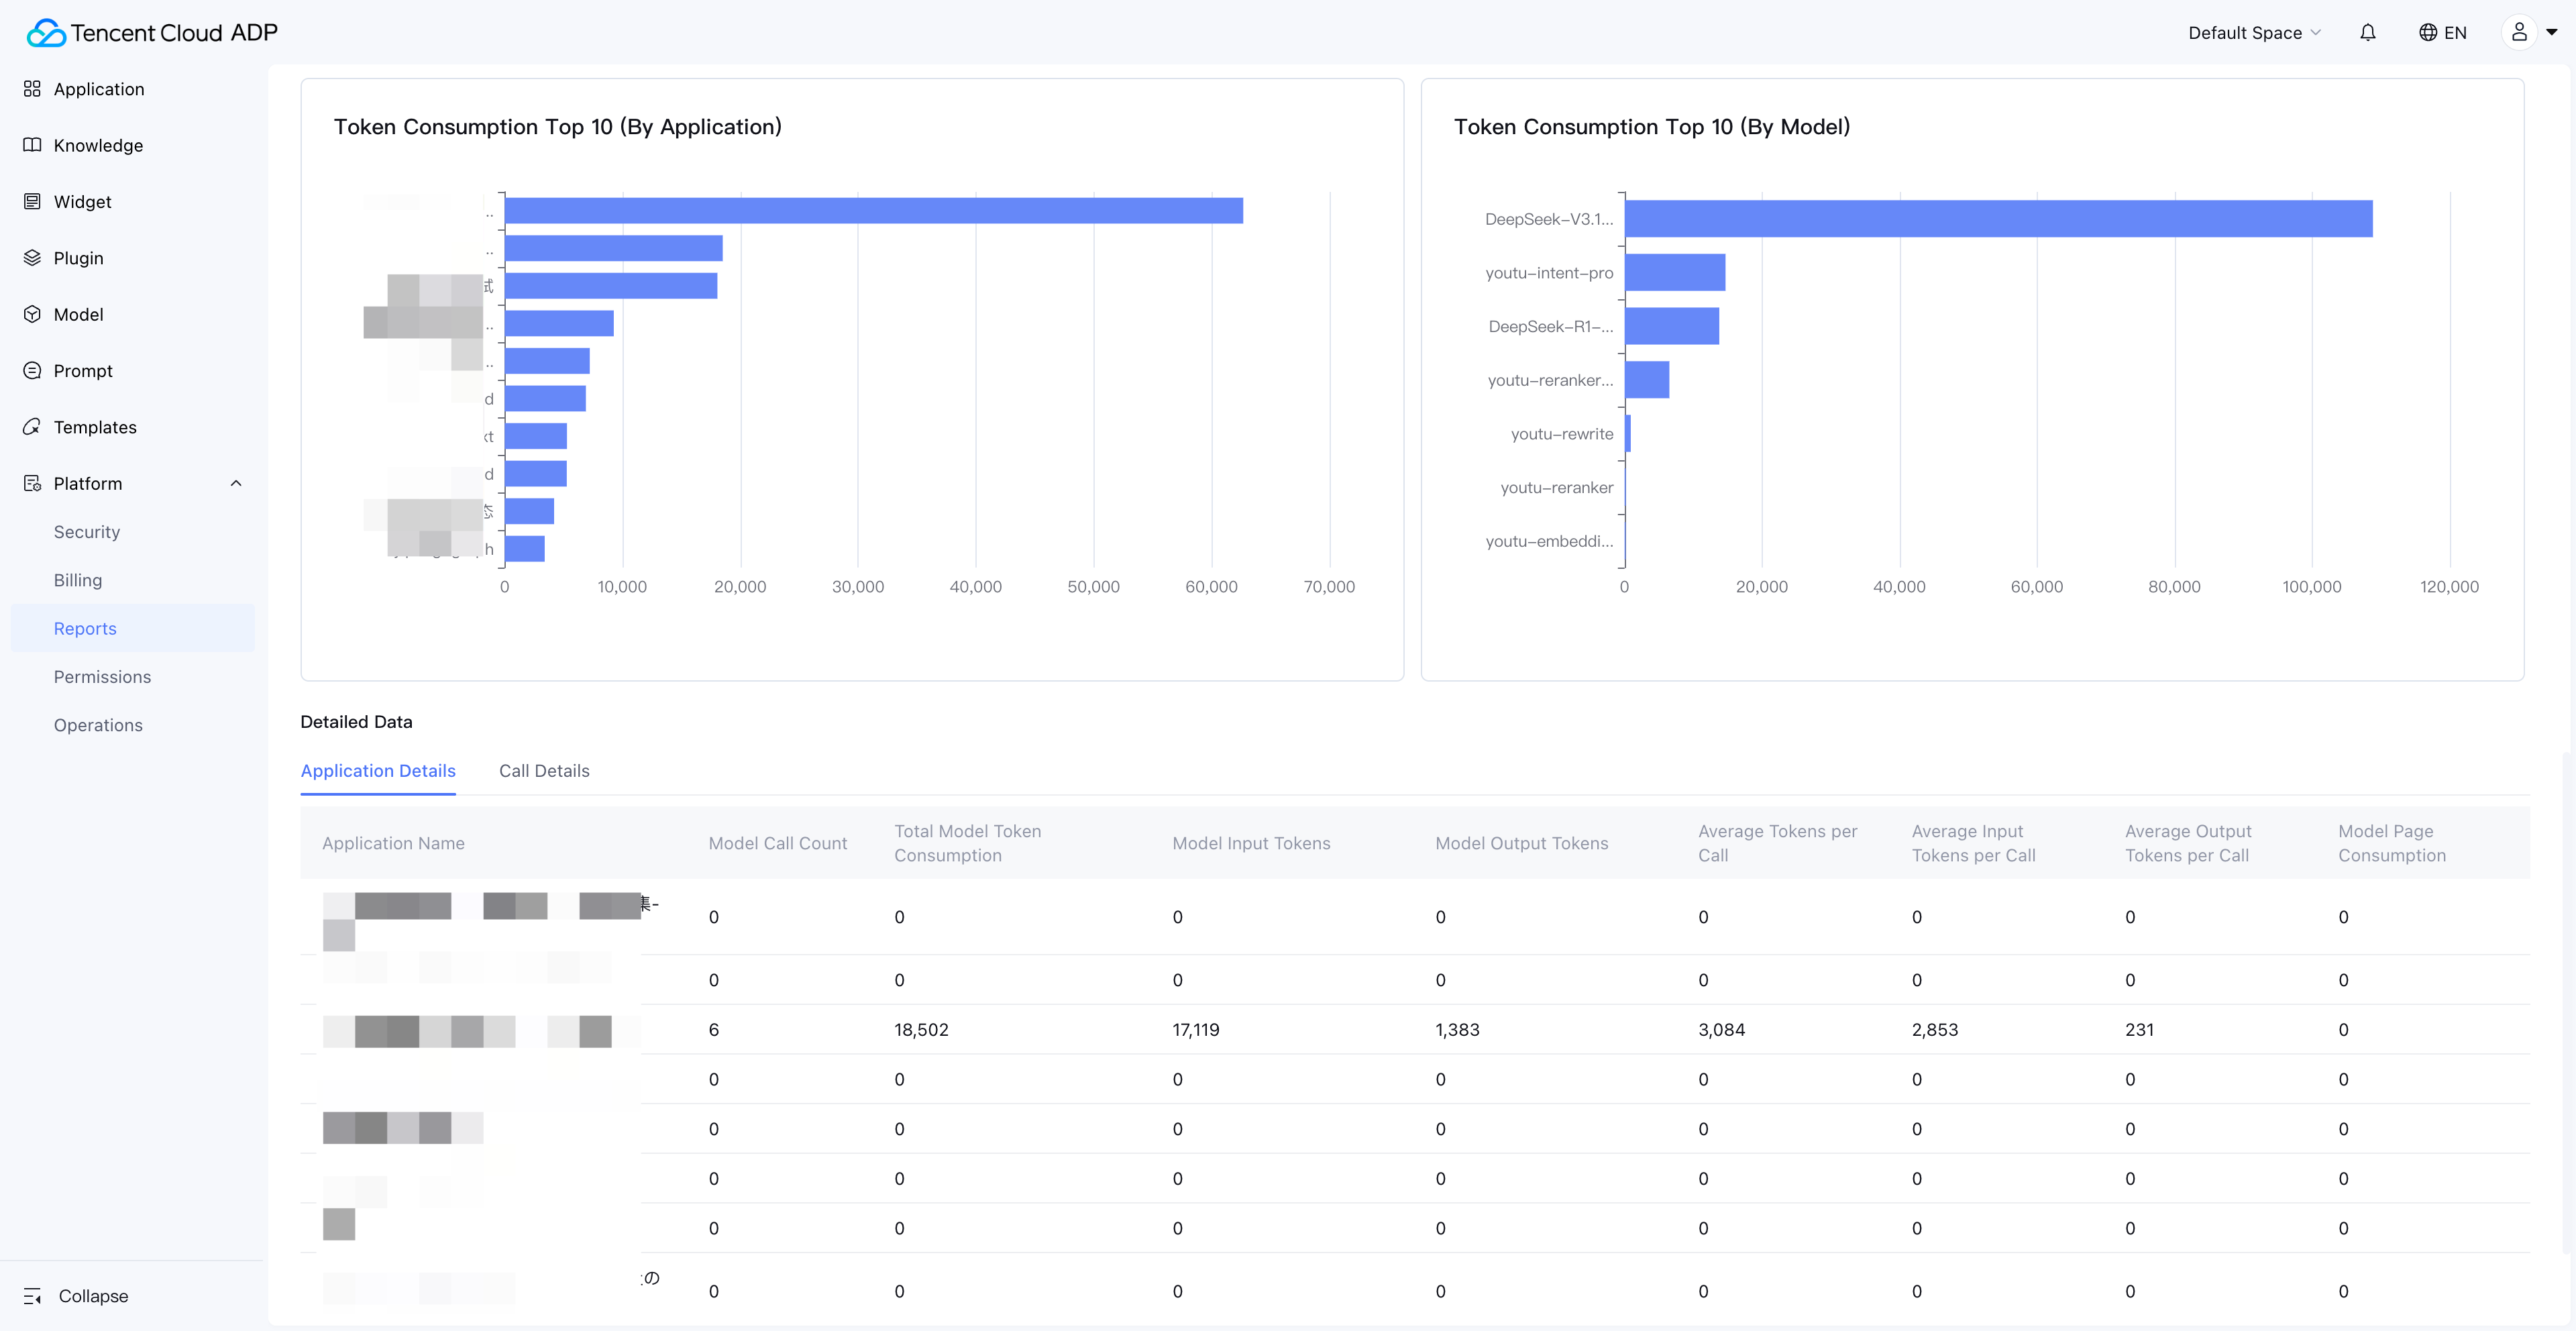
The Resource Dashboard provides not only macro-level model usage trends (line charts, ring charts) but also supports drilling down to each application's model usage, and even viewing individual model call records.
This means when you spot a sudden spike in token consumption on a particular day, you can quickly pinpoint which Agent, which time period, and which model type caused the anomaly.
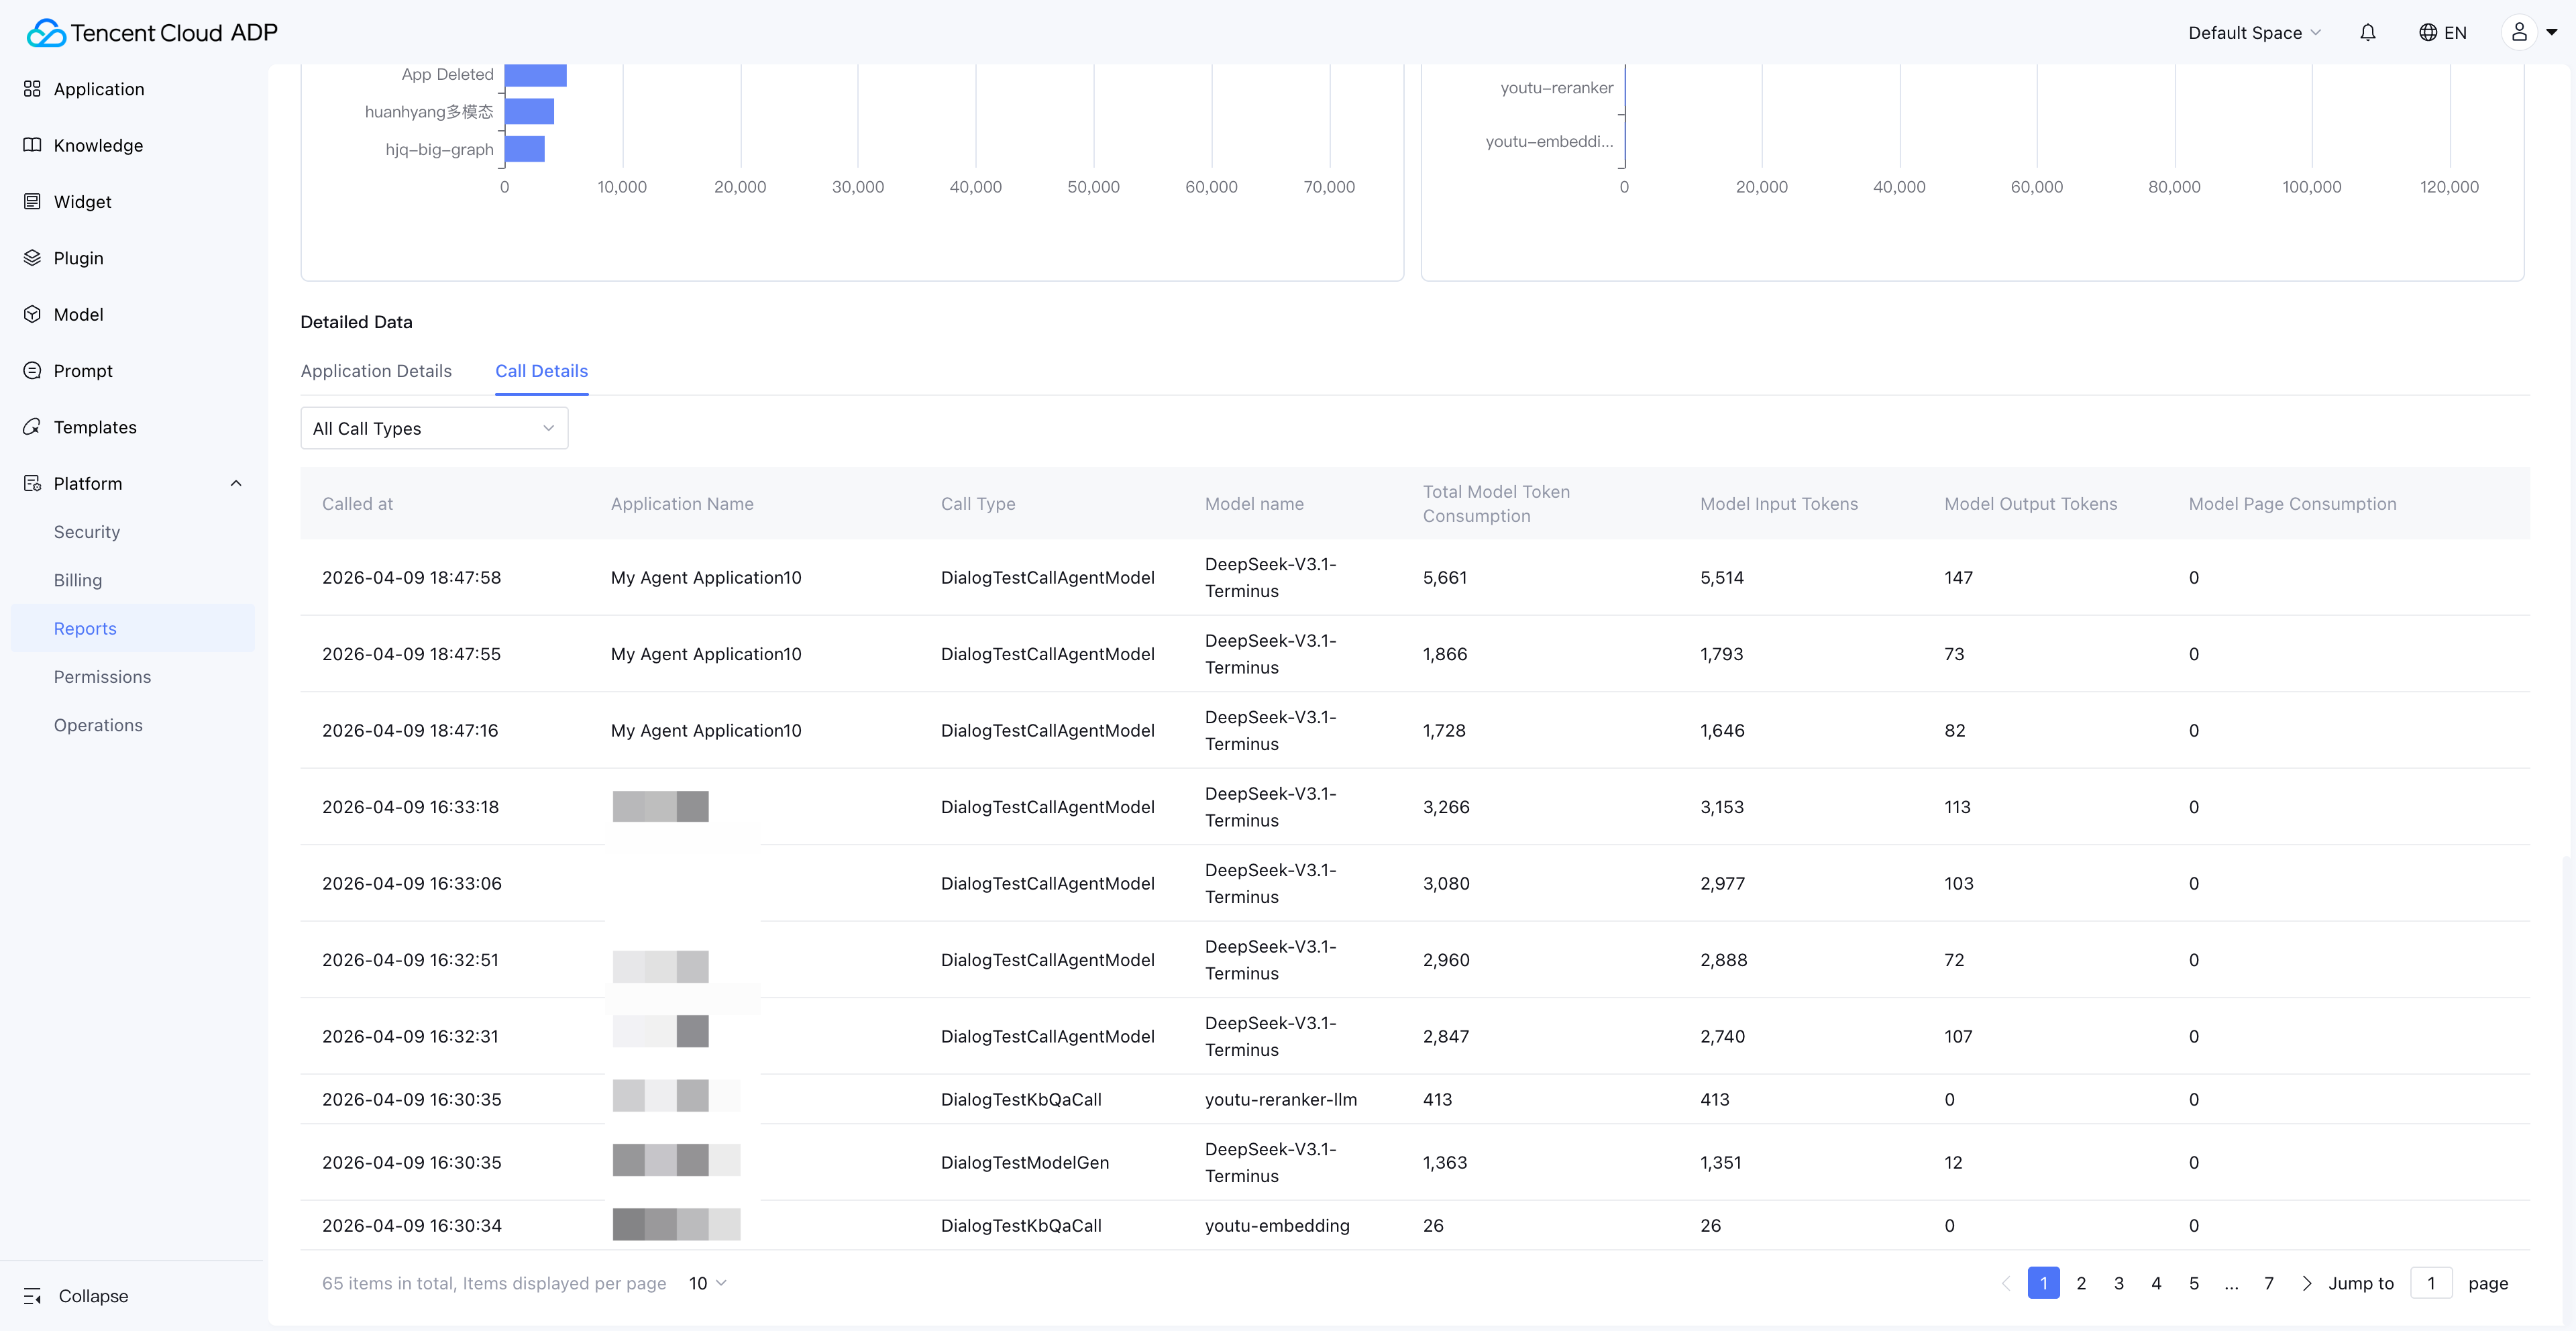
Practical Tips: Token Consumption Anomaly Investigation
When you detect abnormal token consumption, follow this investigation path:
- Enterprise View: Identify which space the abnormal consumption originates from
- Space View → Model Usage: Identify which application is responsible
- Application Details → Call Records: Review specific call parameters and token consumption
- Root Cause Analysis: Common causes include overly long prompts, missing Max Token limits, and recursive calls
4. Model Concurrency Monitoring: The Key to Preventing Performance Bottlenecks
Model Concurrency is the most common bottleneck for AI Agents under high-load scenarios. The Resource Dashboard provides concurrency monitoring for generation and reasoning models, helping enterprises take action before bottlenecks occur.
Three Concurrency Limit Mechanisms
| Metric | Full Name | Meaning | Applicable Scenario |
|---|---|---|---|
| QPM | Queries Per Minute | Maximum requests per minute | Token-billed models |
| TPM | Tokens Per Minute | Maximum tokens processed per minute | Token-billed models |
| Concurrency | Concurrency Count | Maximum simultaneous calls | Models with dedicated concurrency purchased |
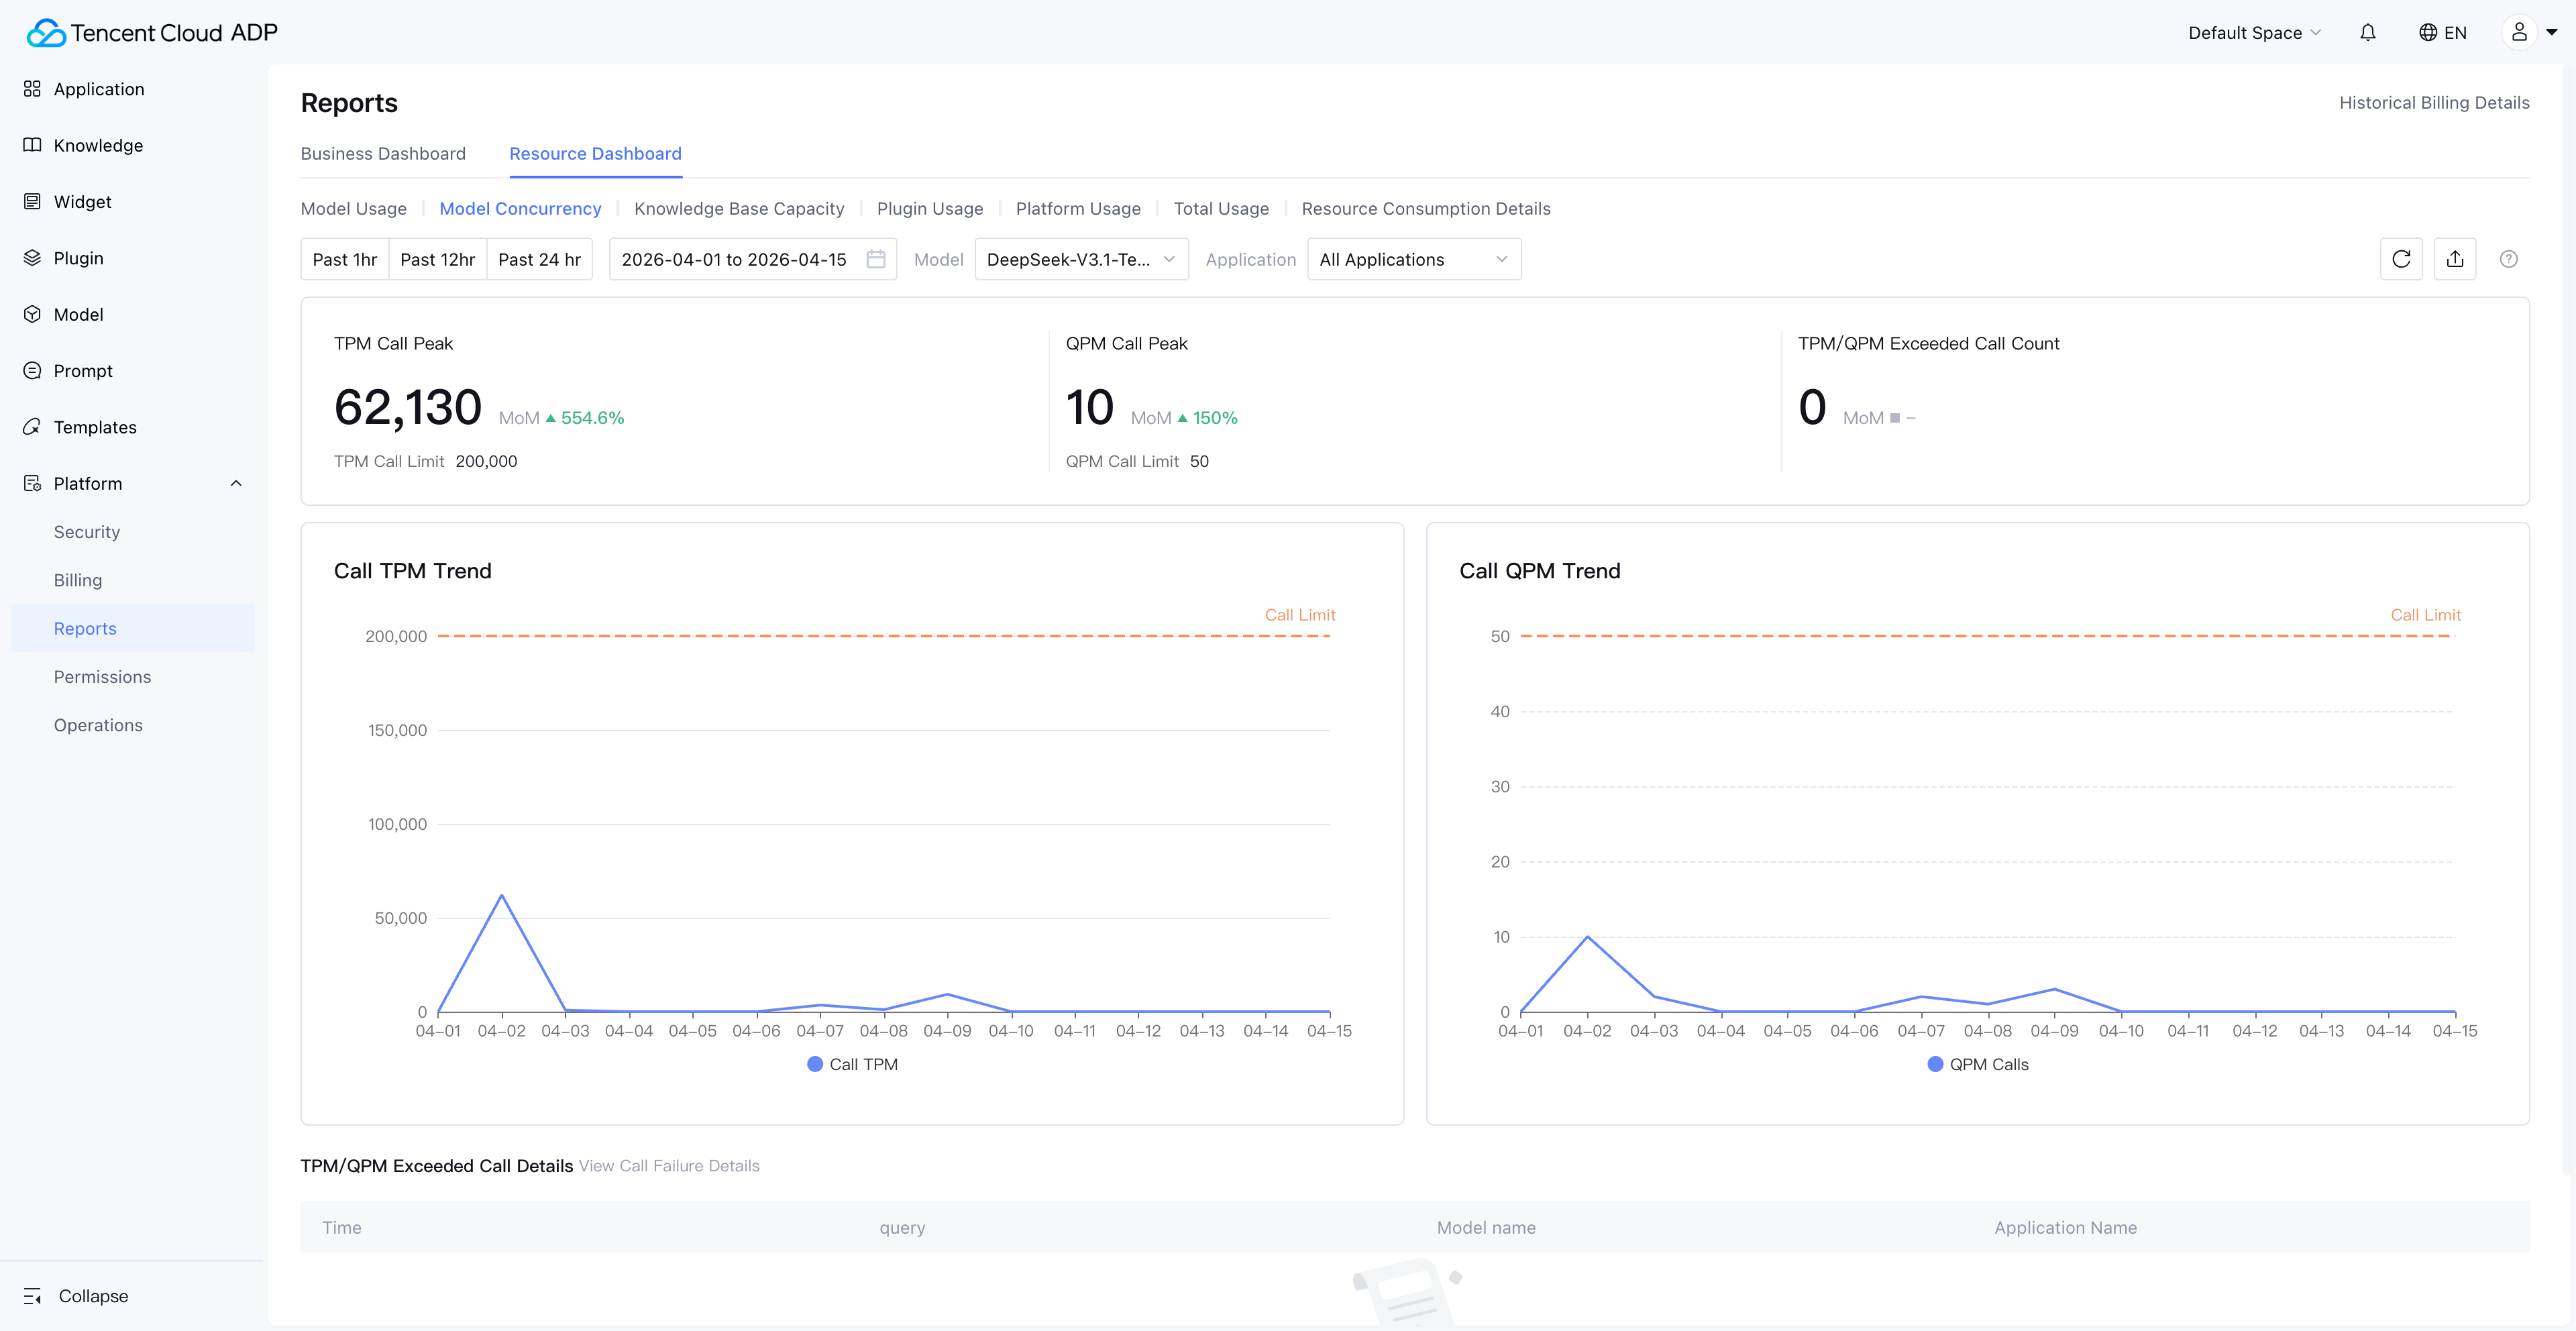
The Practical Value of Concurrency Monitoring
Concurrency monitoring isn't a "nice-to-have" dashboard—it's an early warning system that directly impacts user experience:
- QPM approaching limit: Request queuing is imminent; user-perceived latency will spike dramatically
- TPM approaching limit: Especially dangerous in long-text conversation scenarios where a single request may consume massive tokens
- Concurrency maxed out: New requests are rejected outright, causing Agent service unavailability
Through the Resource Dashboard's concurrency trend charts, enterprises can identify peak-hour concurrency patterns and proactively scale or adjust scheduling strategies, rather than reacting only after user complaints.
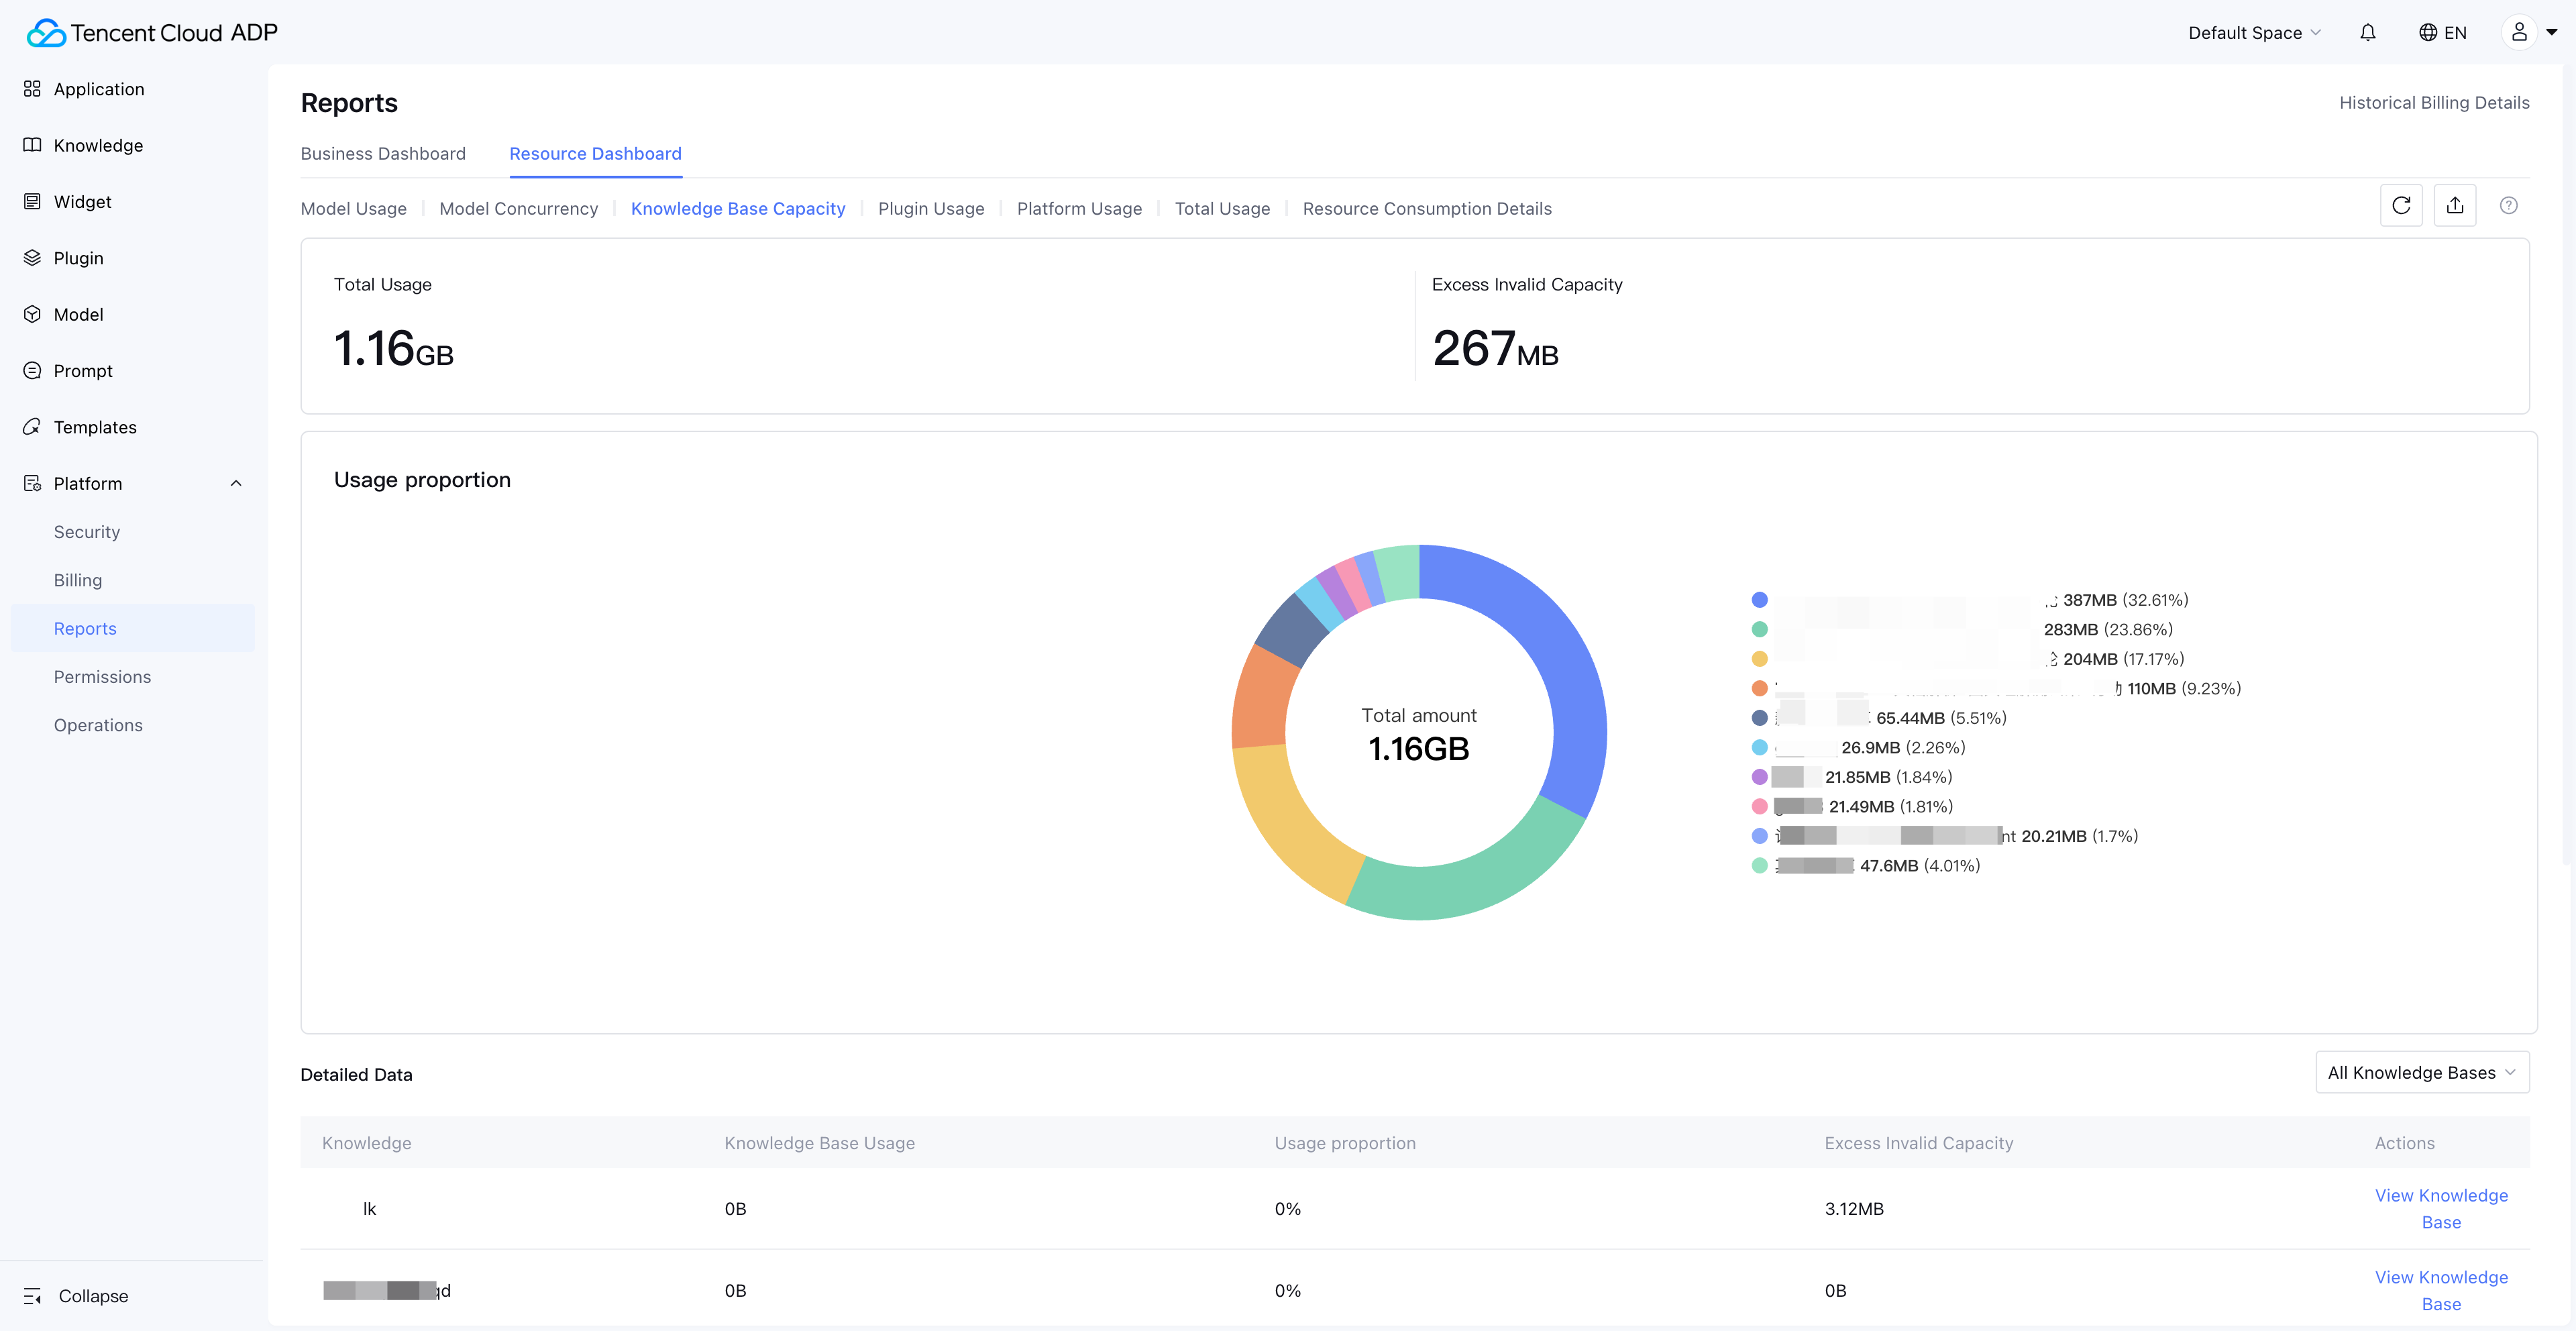
5. Knowledge Base Capacity Monitoring: Ensuring Information Freshness in Agent Responses
The knowledge base is the "memory" of AI Agents in a RAG (Retrieval-Augmented Generation) architecture. Knowledge base capacity monitoring ensures Agents always respond based on the most current and complete knowledge.
Enterprise View: Global Knowledge Base Resource Distribution
In the Enterprise View, administrators can see the aggregated usage of all knowledge bases across the enterprise, along with each knowledge base's resource utilization proportion. This is critical for cross-department knowledge resource allocation decisions.
Space View: Knowledge Base Over-Capacity Alerts
The Space View's knowledge base monitoring is more granular—it not only displays the current space's knowledge base usage but also flags knowledge over-capacity invalidation, where documents exceeding the capacity limit can no longer be retrieved normally.
Consequences of Knowledge Base Capacity Loss of Control
| Stage | Symptom | Business Impact |
|---|---|---|
| Approaching limit | New document ingestion slows down | Knowledge update delays |
| Over limit | New documents can't be ingested, marked as "over-capacity invalidated" | Agent answers based on outdated information |
| Prolonged over-limit | Older documents may also be flagged as invalidated | Agent answer quality severely degrades |
Through the Resource Dashboard's knowledge base capacity monitoring, enterprises can set capacity warning thresholds (e.g., 80%) and proactively clean up expired documents or upgrade plans before hitting the limit.
6. Plugin Usage and Platform Usage: Completing the Resource Consumption Picture
AI Agent resource consumption goes beyond model tokens. Plugin calls, long-term memory storage, content safety reviews, and web search capabilities all generate resource consumption. The Resource Dashboard brings these dimensions into unified monitoring.
Plugin Usage Monitoring
Paid plugins provided by Tencent Cloud ADP can be tracked for call volume and consumption in the Resource Dashboard. Third-party plugins and beta plugins display call counts.
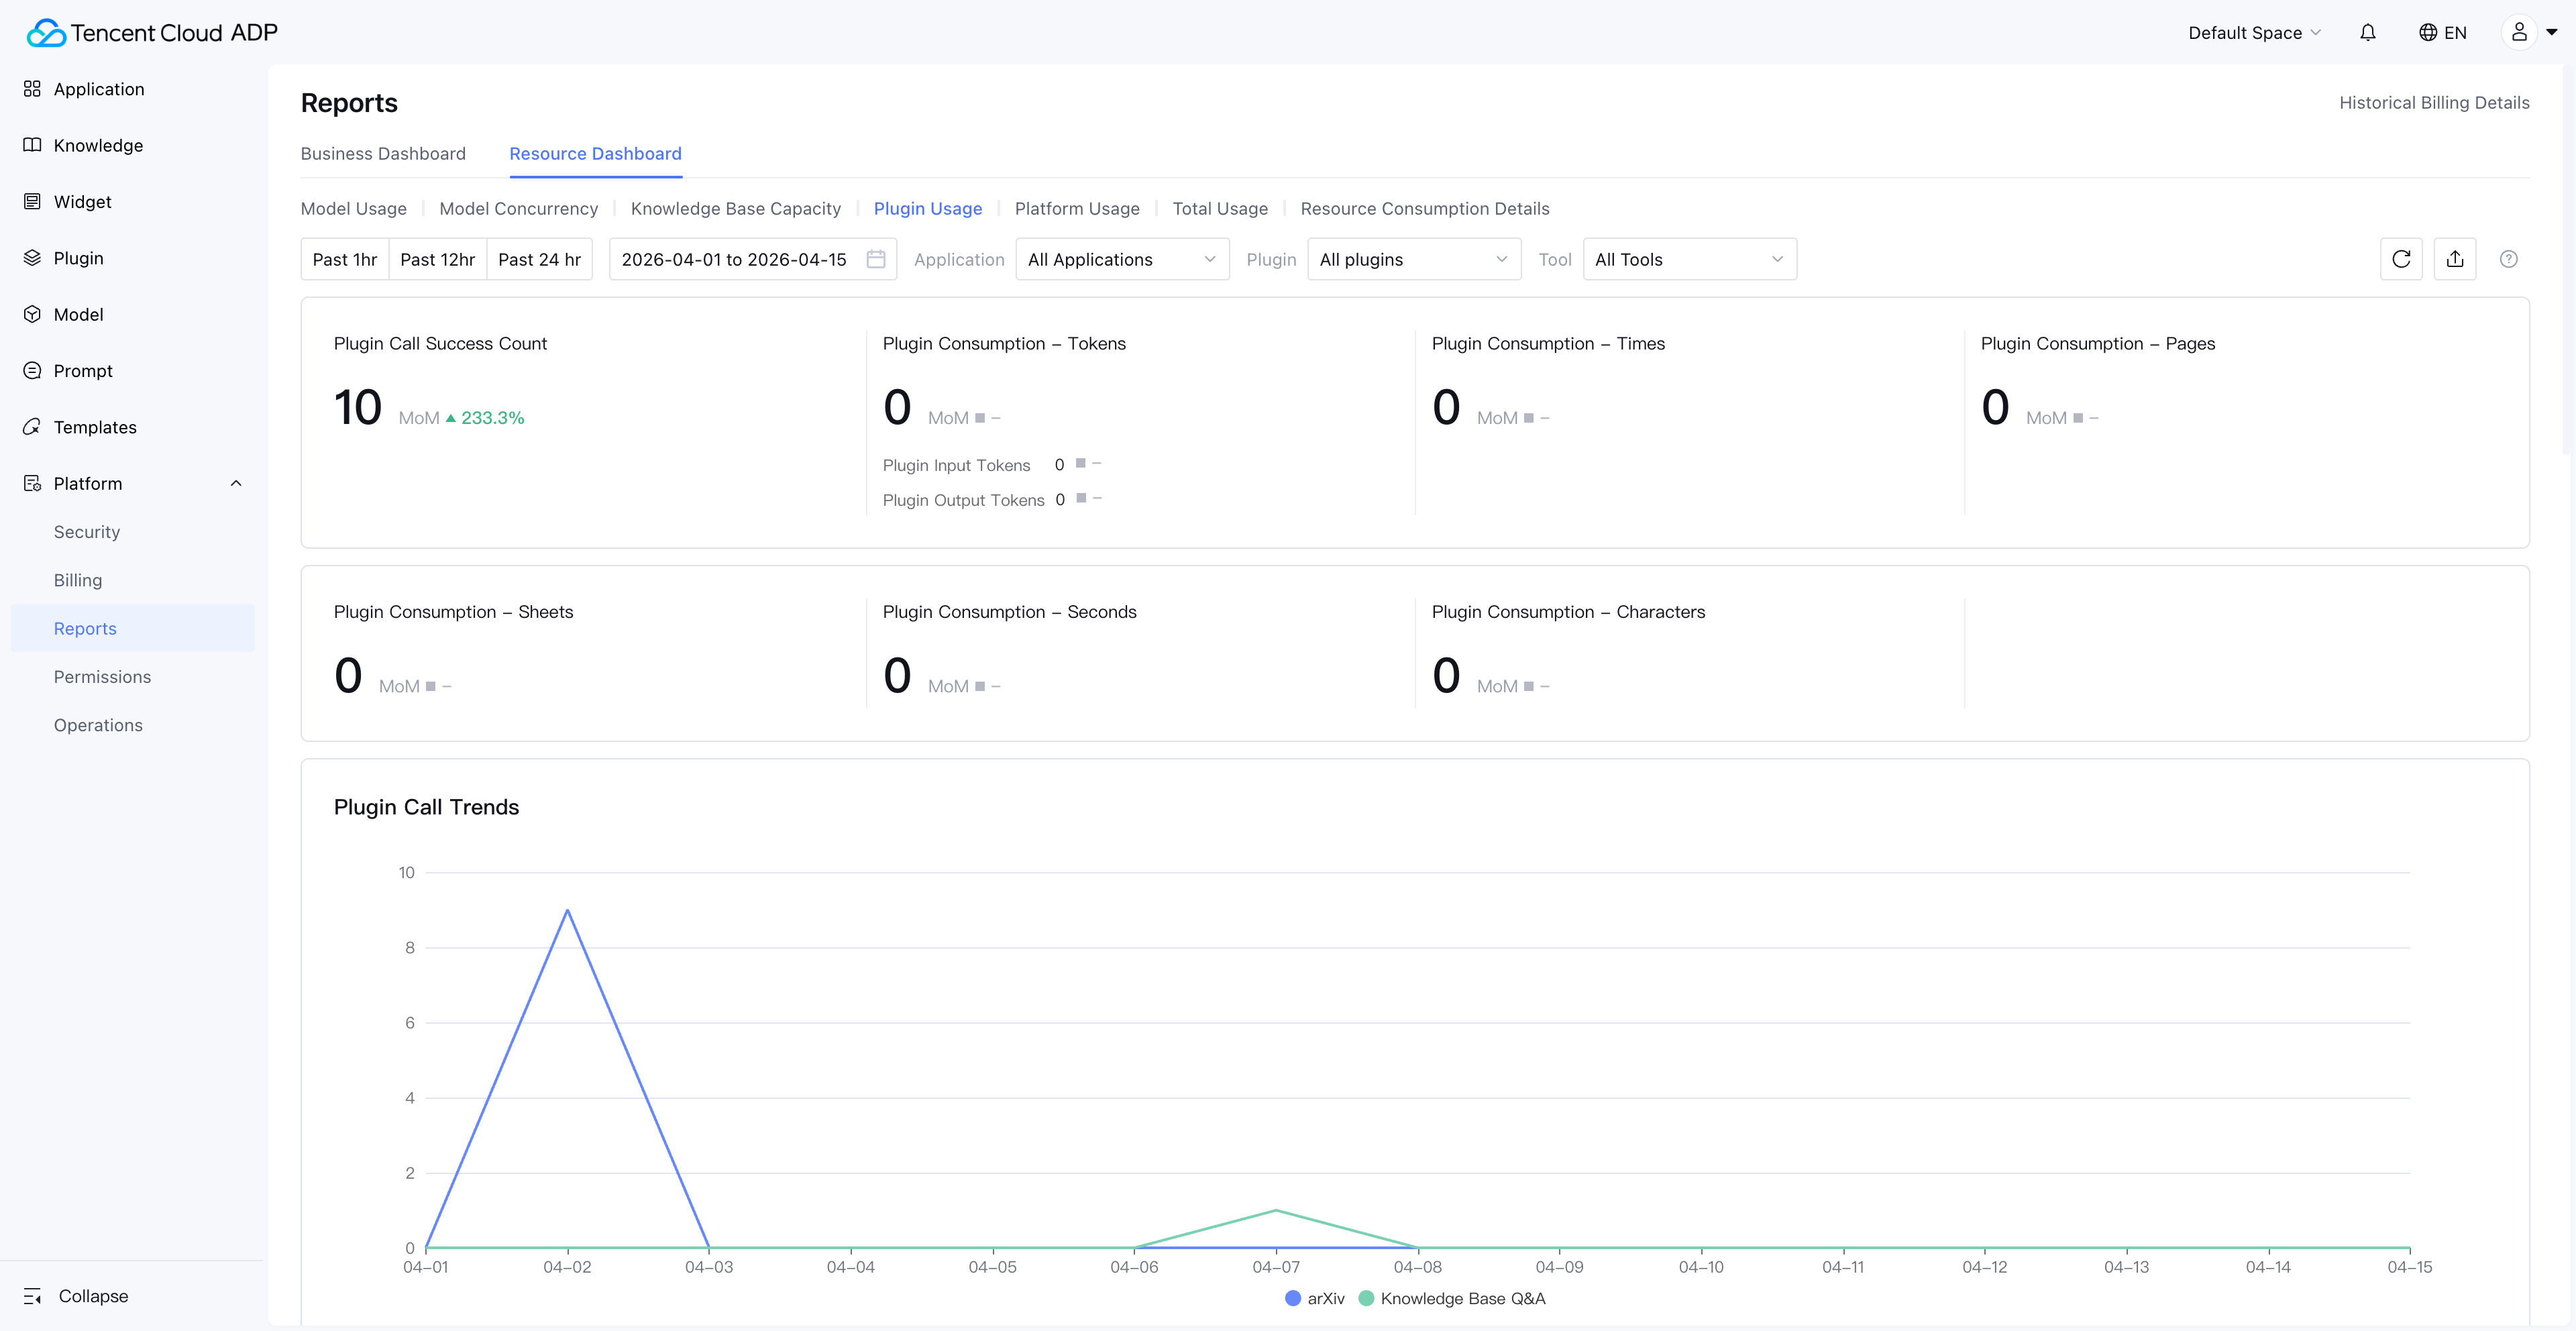
Note: Knowledge base Q&A plugin consumption data is viewed under Model Usage, not Plugin Usage.
Platform Usage Monitoring
Platform usage covers three easily overlooked resource consumption categories:
| Platform Capability | Measurement | Why Monitor It |
|---|---|---|
| Long-term Memory Storage | Storage volume | User profiles and conversation history grow continuously; storage costs need periodic evaluation |
| Content Safety Review | Call count | Every conversation may trigger content safety review; consumption is significant in high-frequency scenarios |
| Web Search | Call count | Agent web search capability usage frequency directly impacts costs |
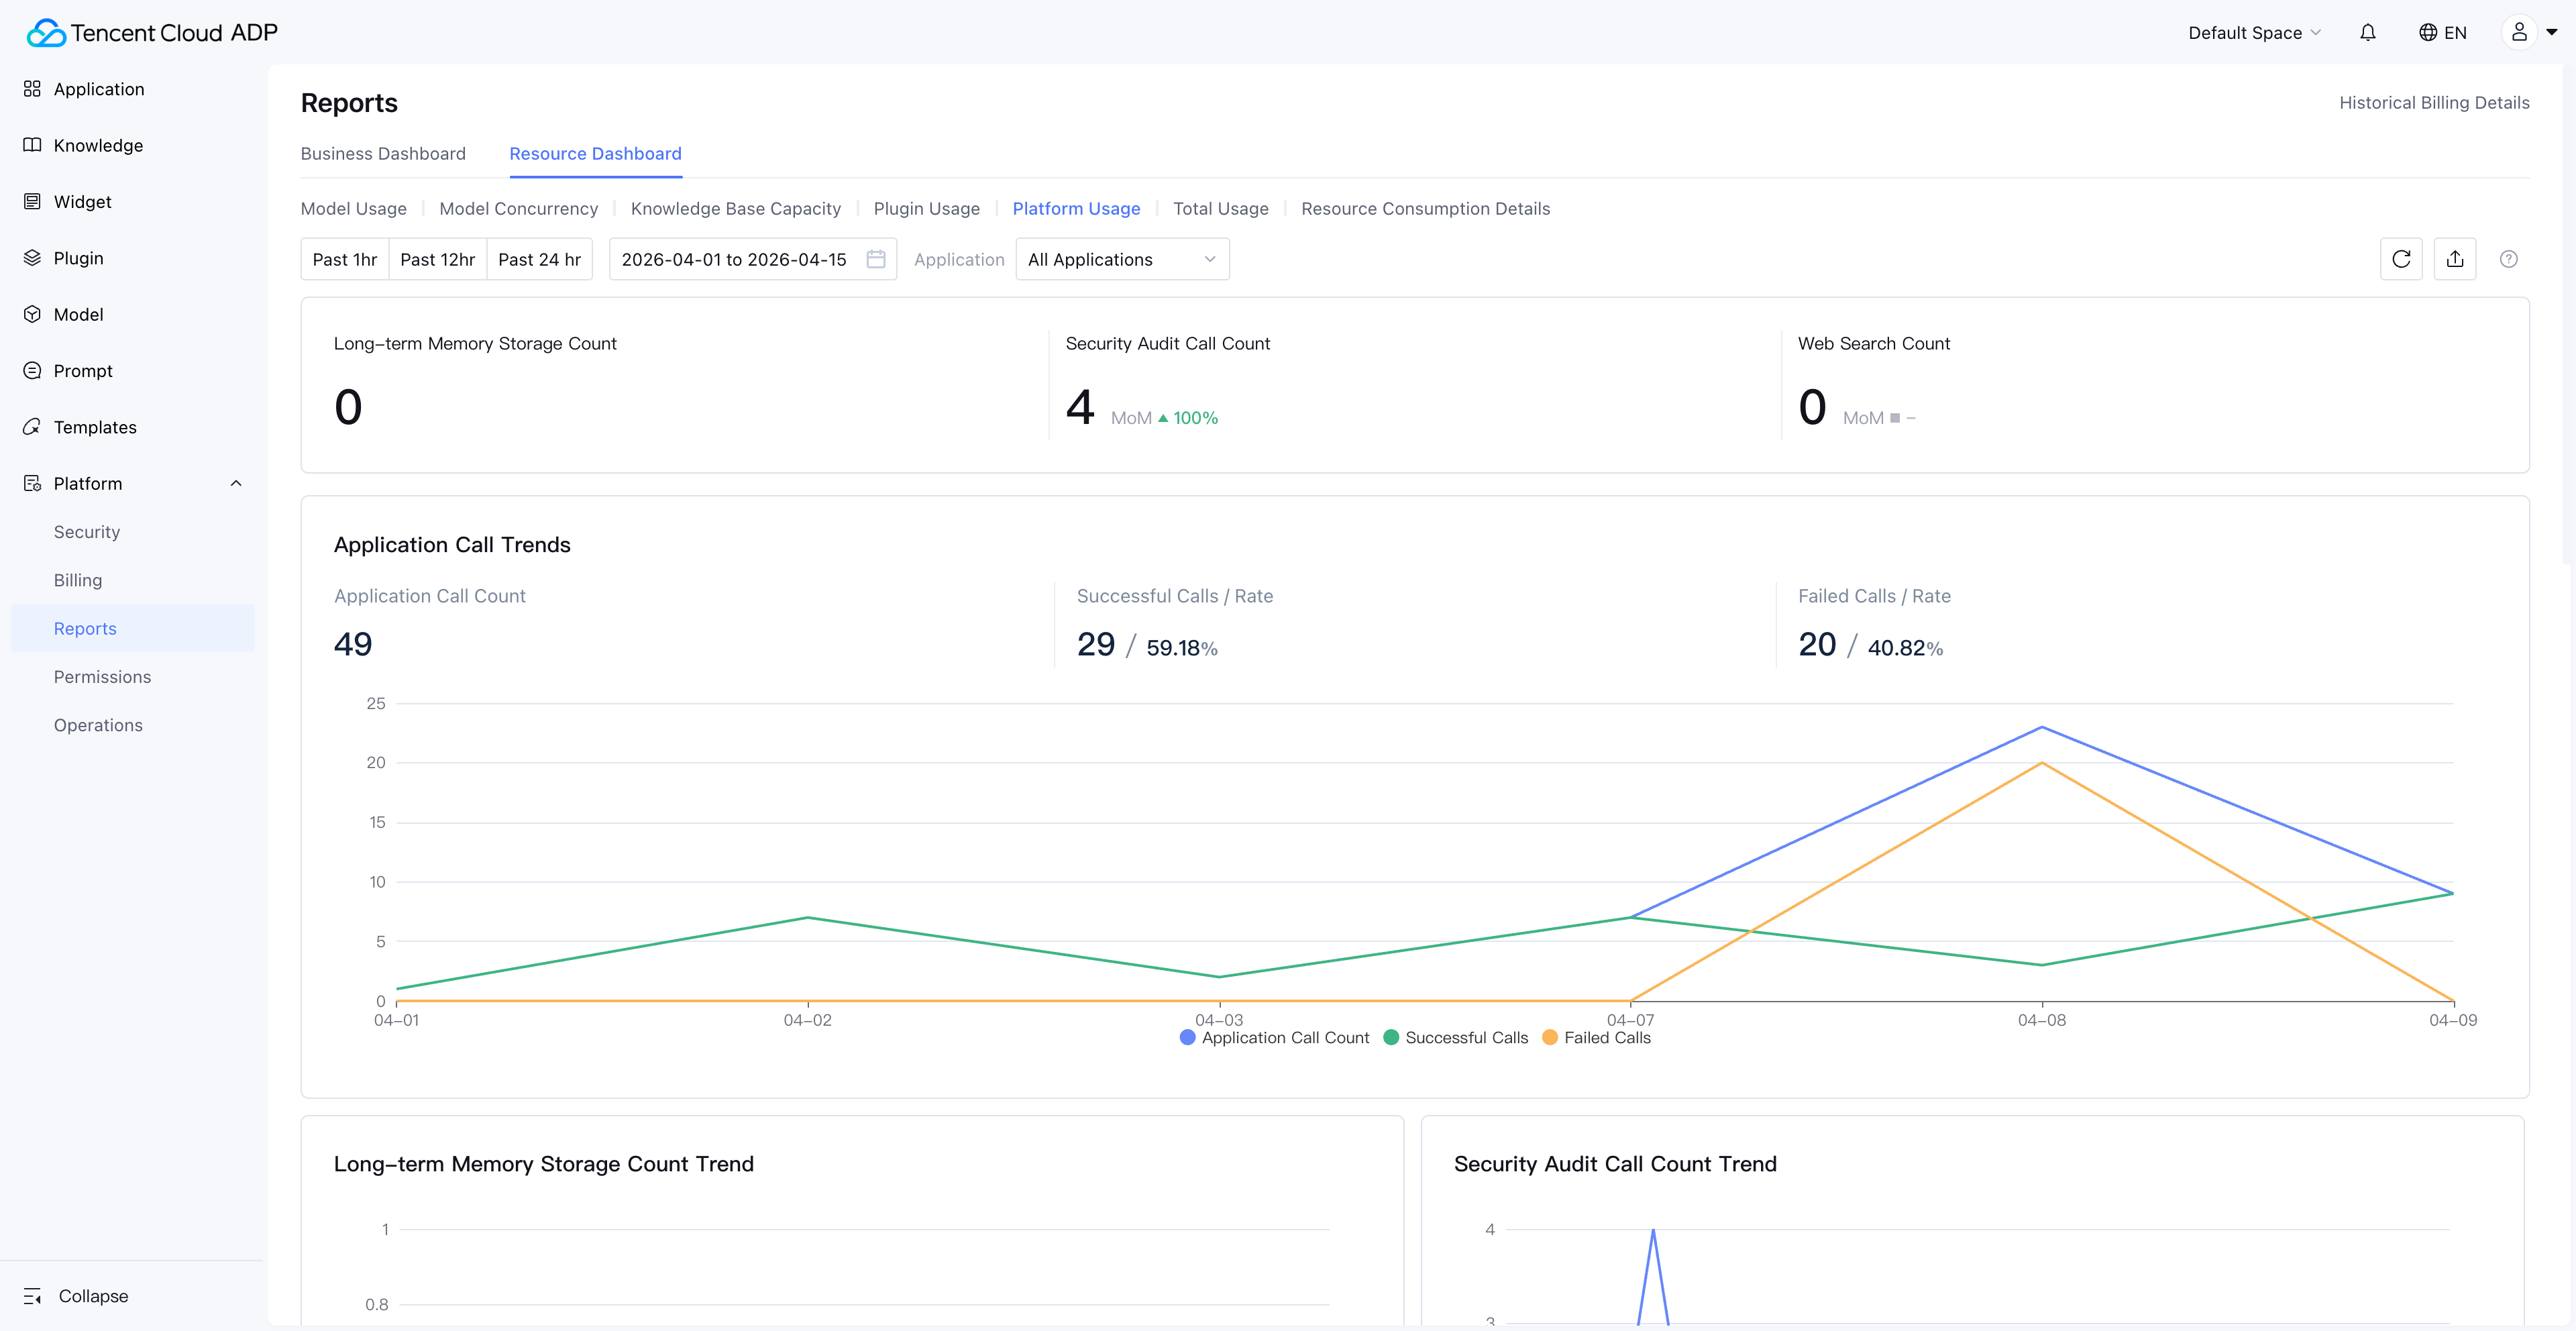
These "hidden costs" are often inconspicuous when Agents first go live but accumulate rapidly as user volume grows. The Resource Dashboard displays them alongside model usage and plugin usage, helping enterprises build a complete cost picture.
7. Cost Attribution: Per-Application ROI Analysis
The ultimate value of AI Agent Observability isn't "seeing data"—it's making every Agent's cost attributable and ROI quantifiable. The Resource Dashboard's "Usage Summary" and "Resource Consumption Details" modules are designed precisely for this purpose.
Usage Summary: Per-Application Resource Aggregation
Usage Summary supports viewing each Agent's aggregated resource consumption by application. This means you can directly answer the question: "How much did the customer service Agent cost this month?"
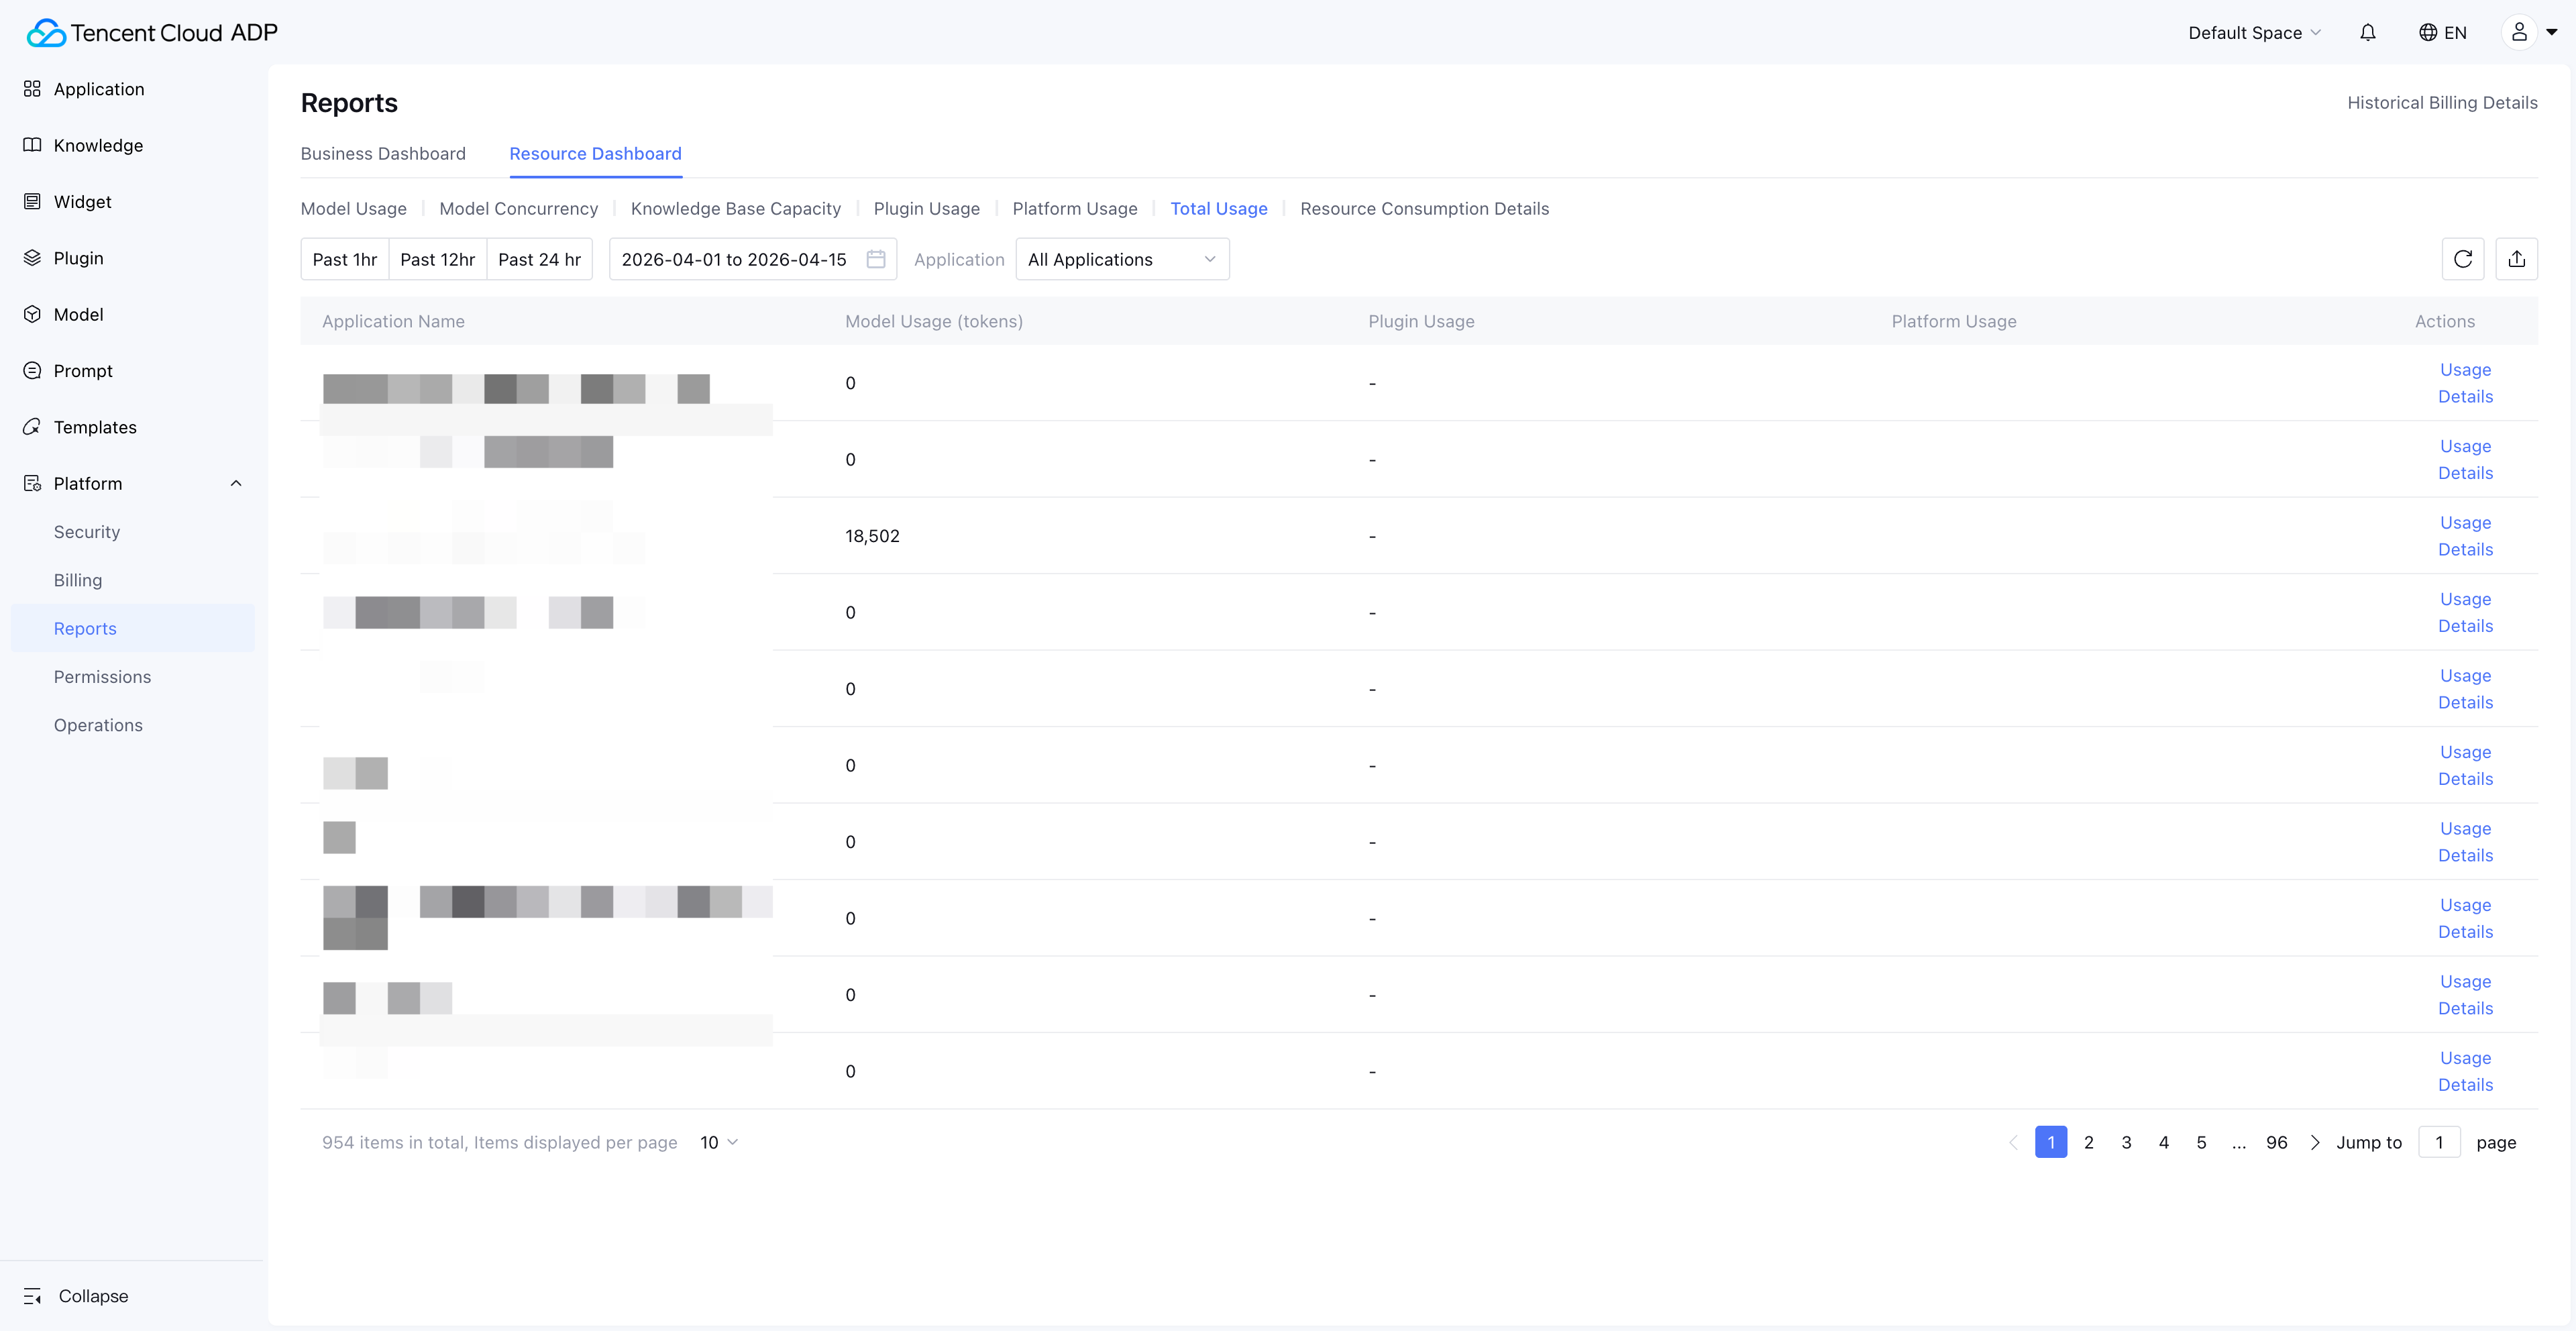
Note: Usage Summary does not include knowledge base and Widget usage—these need to be viewed in their respective dedicated dashboards.
Resource Consumption Details: PU Deduction Tracking
Resource Consumption Details provides the finest-grained consumption records, including PU (Platform Unit) deduction information for each resource consumption entry. Enterprise finance and technical managers can use this for precise cost accounting.
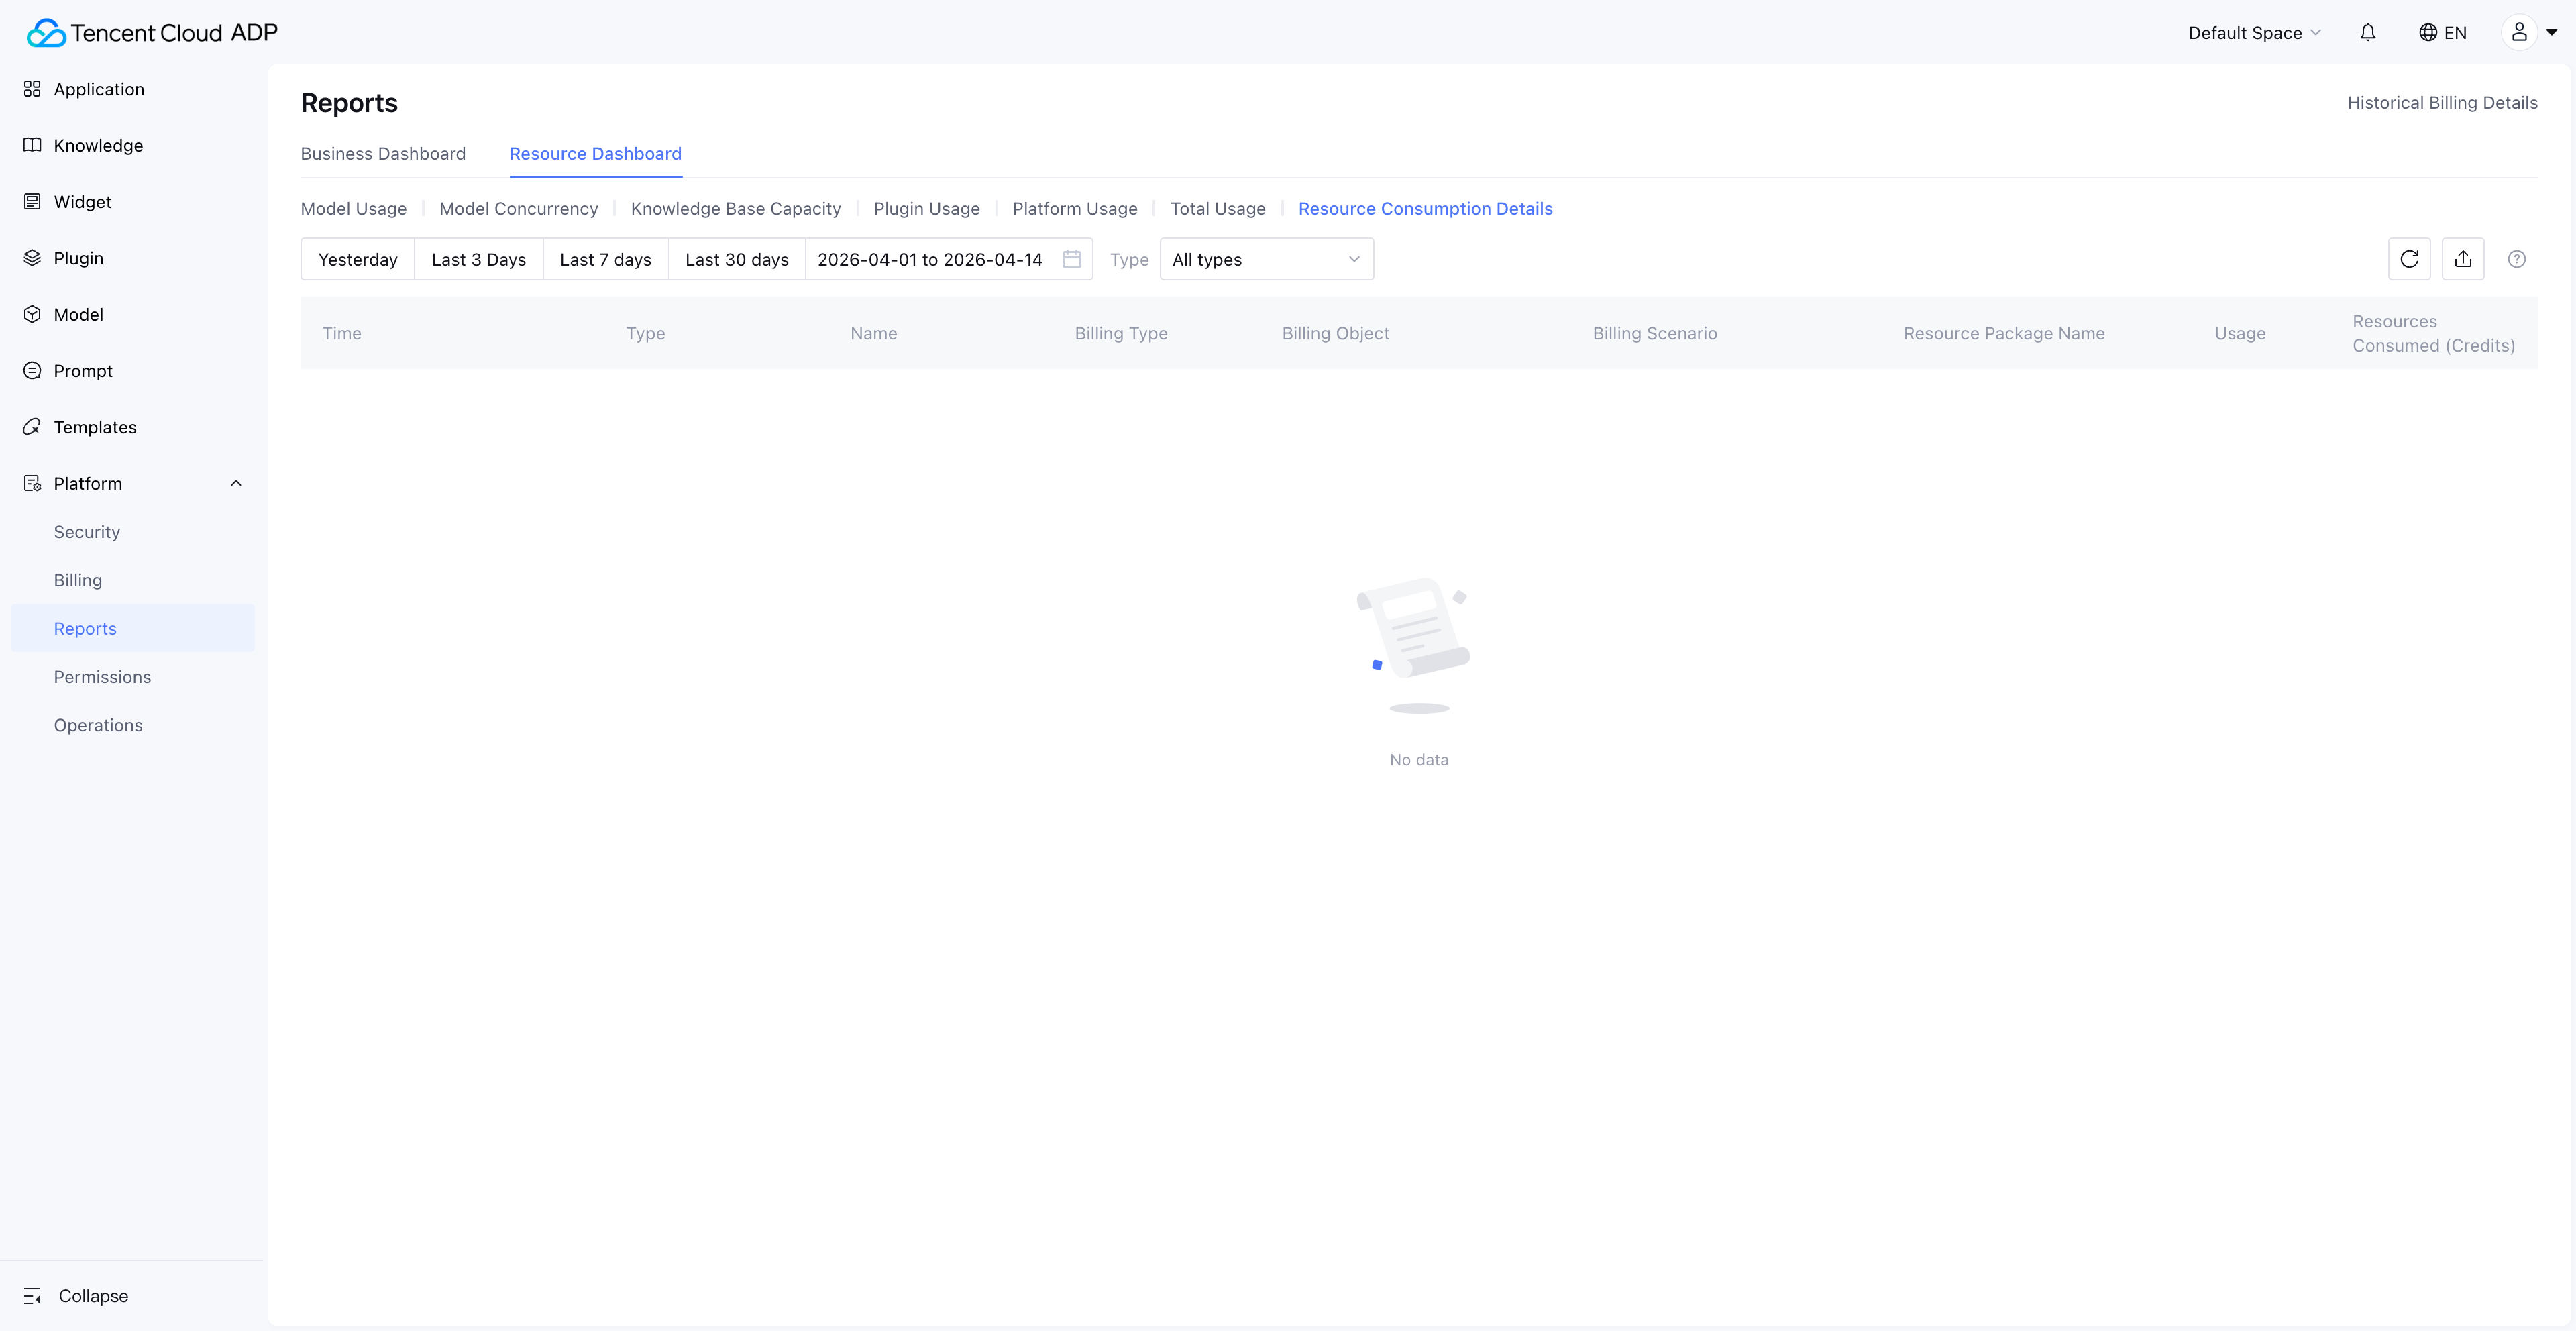
Data Freshness Note: Resource Consumption Details covers 30 days of data; all other dashboards support viewing and exporting 90 days of data.
Practical Applications of Cost Attribution
| Scenario | Action Path | Decision Output |
|---|---|---|
| Monthly cost review | Usage Summary → Sort by application → Identify Top 5 consuming Agents | Optimize high-consumption Agents' prompts or model selection |
| Budget allocation | Enterprise View → Consumption proportion by space | Reallocate resource quotas based on business value |
| ROI assessment | Usage Summary (cost) + Business metrics (effectiveness) | Calculate per-conversation cost and business conversion rate for each Agent |
| Anomaly alerting | Resource Consumption Details → Day-over-day comparison | Detect consumption spikes and investigate root causes promptly |
8. From Monitoring to Intelligent Operations: AI Agent Observability Best Practices
After mastering the Resource Dashboard's 7 monitoring dimensions, how do you upgrade from "passively viewing data" to "proactive intelligent operations"? Here are proven best practices.
Practice 1: Establish a Tiered Monitoring Framework
| Level | Frequency | Focus Dimensions | Owner |
|---|---|---|---|
| L1 Daily | Daily | Model usage trends, concurrency peaks | Development lead |
| L2 Weekly | Weekly | Knowledge base capacity, plugin usage changes | Product manager |
| L3 Monthly | Monthly | Usage summary, cost attribution, ROI | Technical director/CTO |
Practice 2: Set Key Metric Alert Thresholds
- Token consumption: Alert when daily consumption exceeds 1/25 of the monthly budget
- Concurrency usage: Alert when QPM/TPM reaches 80% of the limit
- Knowledge base capacity: Alert when utilization reaches 80%
- Per-application cost: Alert when a single Agent's daily consumption exceeds 200% of its historical average
Practice 3: Periodically Optimize Resource Configuration
Based on Resource Dashboard data, execute a resource optimization cycle monthly:
- Model downgrade: For scenarios with lower answer quality requirements, switch from reasoning models to generation models
- Prompt optimization: For the Top 3 token-consuming Agents, review and optimize prompt length
- Knowledge base cleanup: Remove expired documents, merge duplicate knowledge
- Concurrency adjustment: Based on actual peak data, adjust concurrency quota allocation
When Might Observability Not Be Enough?
To be transparent, the Resource Dashboard addresses "resource-level" observability. The following scenarios require additional tools:
- Conversation quality monitoring: Agent answer accuracy, user satisfaction, etc., need to be combined with business metrics systems
- Real-time alerting: The Resource Dashboard provides data dashboards; real-time alerting requires integration with enterprise monitoring and alerting platforms
- Cross-platform monitoring: If Agents also use models or services outside the platform, that consumption falls outside the dashboard's scope
9. Resource Dashboard Permissions and Data Scope
In enterprise environments, "who can see what data" is just as important as the data itself. The Resource Dashboard's permission design follows the principle of least privilege.
| View | Default Visible Role | Authorization Method | Data Scope |
|---|---|---|---|
| Enterprise View | Super administrator | Enterprise management backend settings | All spaces under the enterprise |
| Space View | Space administrator | Add functional permissions via platform user management | Current space |
Data Retention Policy
| Data Type | Retention Period | Export Supported |
|---|---|---|
| Resource Consumption Details | 30 days | Yes |
| Other Dashboard Data | 90 days | Yes |
Prerequisite: The Resource Dashboard feature is only available to users who have purchased a subscription package.
10. Conclusion: AI Agent Observability Is Essential for Enterprise Deployment
AI Agent Observability isn't a "nice-to-have"—it's essential infrastructure for enterprises moving AI Agents from demo to production. Without observability, enterprise AI Agent management stays at the "it works, good enough" stage; with observability, enterprises can achieve "works well, costs less, runs stable."
Tencent Cloud ADP's Resource Dashboard, through its two-tier architecture of Enterprise View and Space View, covers 7 dimensions—model usage, model concurrency, knowledge base capacity, plugin usage, platform usage, usage summary, and resource consumption details—providing enterprises with complete AI Agent monitoring capabilities from global overview to fine-grained tracking.
Key Action Items:
- Start now: Log in to Tencent Cloud ADP and check your current resource consumption status in the Resource Dashboard
- Establish baselines: Record current consumption data across all dimensions as benchmarks for future optimization
- Set alerts: Configure alert thresholds for token consumption, concurrency usage, and knowledge base capacity
- Review regularly: Conduct monthly cost attribution analysis and resource optimization based on Usage Summary
Frequently Asked Questions
What is AI Agent Observability? How does it differ from traditional monitoring?
AI Agent Observability refers to the systematic monitoring and analysis of multi-dimensional resources during AI Agent runtime, including model token consumption, concurrency usage, knowledge base capacity, and plugin calls. Unlike traditional IT monitoring that focuses on CPU, memory, and network, AI Agent Observability centers on dimensions unique to large language models—tokens are the core unit of measurement, concurrency limits (QPM/TPM) are the primary source of performance bottlenecks, and knowledge base capacity directly affects answer quality.
How can I view resource consumption for all AI Agents across the enterprise?
In Tencent Cloud ADP, navigate to Enterprise Management > Data Reports via the avatar in the top-right corner to access the Enterprise View Resource Dashboard. This view provides aggregated model usage, knowledge base capacity, plugin usage, and other data across all spaces, with resource consumption proportion breakdowns by space. Note that the Enterprise View is only visible to super administrators.
What metrics does AI Agent model concurrency monitoring include?
The Resource Dashboard's model concurrency monitoring covers three core metrics: QPM (Queries Per Minute), TPM (Tokens Per Minute), and Concurrency Count (simultaneous calls). Token-billed models are subject to QPM and TPM limits, while models with dedicated concurrency purchased are subject to concurrency count limits. When these metrics approach their limits, users experience noticeable response latency or even request failures.
What happens when knowledge base capacity exceeds the limit?
When knowledge base capacity exceeds the limit, newly ingested documents are marked as "over-capacity invalidated" and cannot be retrieved by the Agent normally. This means the Agent's answers will be based on incomplete or outdated knowledge, directly impacting answer accuracy. In the Space View's knowledge base capacity dashboard, you can view specific over-capacity invalidation details. We recommend proactively cleaning up or expanding capacity when utilization reaches 80%.
How can I perform cost attribution for AI Agents using the Resource Dashboard?
The Resource Dashboard's "Usage Summary" module supports viewing each Agent's aggregated resource consumption by application, while the "Resource Consumption Details" module provides PU deduction records for each consumption entry. By combining these two modules, enterprises can precisely calculate each Agent's operating cost and evaluate ROI. We recommend conducting cost attribution analysis monthly to identify high-consumption Agents and optimize them accordingly.
How long is Resource Dashboard data retained?
Resource Consumption Details can be viewed for 30 days, while other dashboards (model usage, concurrency, knowledge base capacity, etc.) support viewing and exporting 90 days of data. We recommend enterprises periodically export key data for long-term trend analysis and annual budget planning.
Who can access the Resource Dashboard feature?
The Resource Dashboard feature is only available to users who have purchased a subscription package. The Enterprise View is visible only to super administrators; the Space View is visible to space administrators by default, and other users need to be granted functional permissions through platform user management. Customers using legacy billing items should refer to the "Billing Resource Usage Details" feature.
Ready to take control of your AI Agent resource consumption?
→ Start Free Trial: Tencent Cloud ADP
*This article is part of the Enterprise AI Agent series. Related reading:
· AI Agent Token Cost Optimization Guide
Start building today
If you need more support, please contact us